
Bigger is Not Always Better
Bigger is Not Always Better

For broad U.S. market exposure, bigger isn't always better. In a multi-asset portfolio, we've long argued the case that being active can provide long-term added value. But being active doesn't necessarily mean solely relying on active managers. Making an active call on allocations, even on a rather generic cheap market beta, can make a difference. ETFs are popular choices, and plain
vanilla market cap ETFs give great exposure to the overall market. But many of the most popular go-to ETFs are simply passive vehicles that mirror market cap indices.
Since mid-2020, we've recommended equal weight exposure versus traditional market cap exposure as a sleeve in multi-asset portfolios. Our rationale was that within the broad U.S. market were hidden risks that we wanted to avoid. Equal
weight basically levels the playing field in today's market. Attempting to maximize returns through diversifying over the long term. Typically, it costs a little more due to more active rebalancing. With ETFs, understanding your
exposures is an indispensable first step because it's in these differences that the alpha can be generated.
Know What You Own
A fund's expense ratio or AUM gathers a lot of interest, but truly digging into a fund's exposure makes a difference. At first glance, you wouldn't think there is much of a difference between the S&P 500 and the S&P 500 Equal Weight. Index
construction matters, and looking under the hood reveals several key differences between the two. Some fundamental differences between the two are outlined in the chart below. What stands out is a definitive tilt towards value as well as more
exposure to dividends for equal weight. Both of these factors tend to outperform during prolonged periods of market stress.

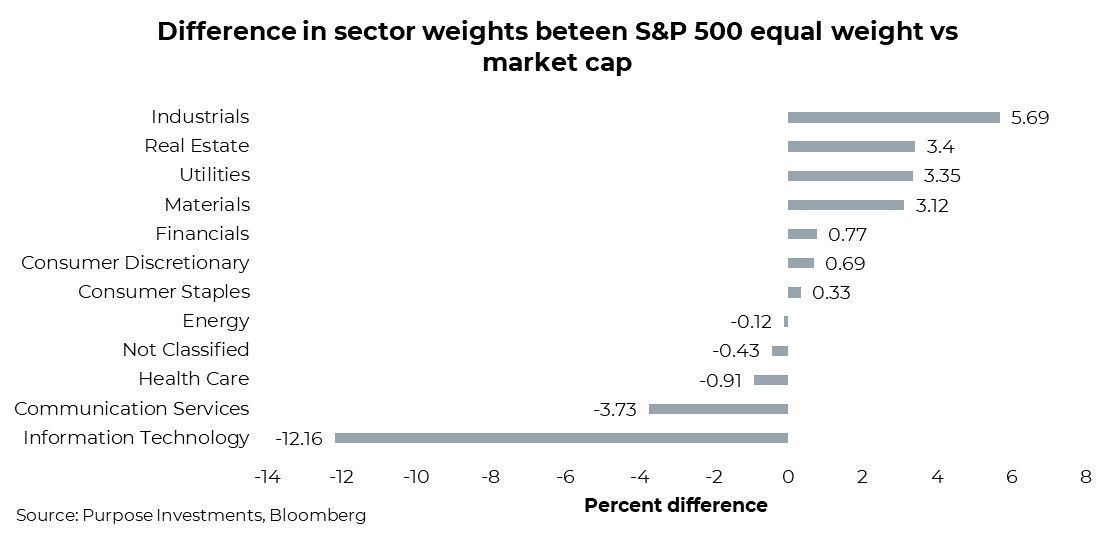
From a sector perspective, this chart outlines the difference in sector weights of equal weight compared to the
cap-weighted index. By far, the largest difference is the weighting in technology. The cap weight is 25.5%, while it's
just 13.3% in the equal weight index, a 12.2% difference. Equal weight is much more balanced with more exposure
to industrials, real estate, utilities, and materials.
Concentration Risks
Though down from its peak in 2021, there remains a considerable amount of concentration risk in the S&P 500.
After the difficult 2022 for many companies in the tech space, the top 5 companies still account for nearly 20% of
the index. Broaden this to the top ten names, and you're up to 27% of the index in just ten companies. Down
from its peak but still well north of where it was in the dot com bubble at around 18%. Concentration risk always
comes down, and it's really never been higher. Words like concentration, top-heavy, and unbalanced have been
talked about a lot over the past few years. It isn't inherently wrong, but it's truly about a lack of diversification.
Concentration risk can be really bad or really good, rarely in between.
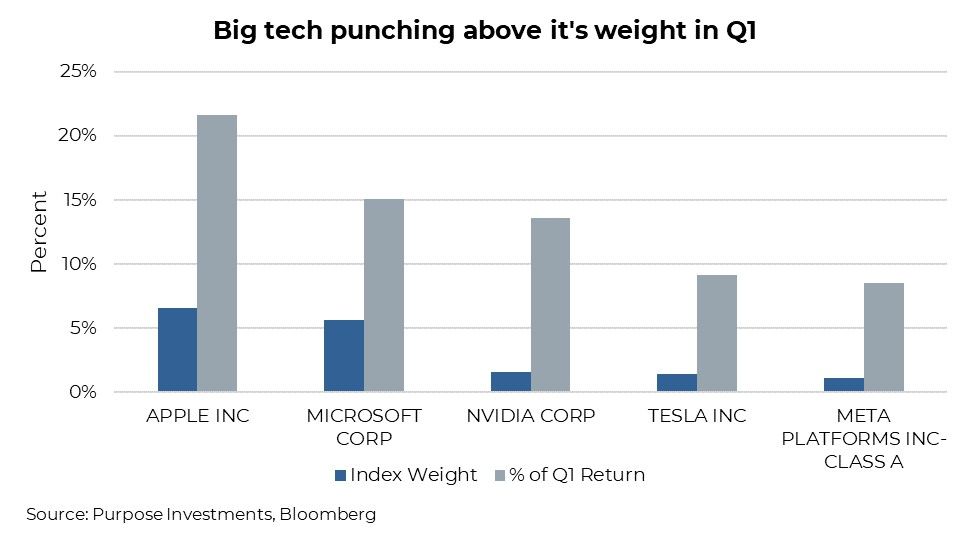
The entire market is now virtually made up of just a small number of stocks. Without just 18 companies, the S&P
500's gains in the first quarter would have been negative. We question the sustainability of this when some of the
biggest tech names have to punch well above their weight to drive market cap outperformance to this degree. The
chart below contrasts the contribution of Q1 returns from some of the largest index members in comparison to
their index weight. Q1 has been an aberration from recent trends, and we do not see it as simply the resumption of
previous bull market winners.
Recent Performance – Markets back to their old ways
Equal weight began its outperformance following covid and has been a decided winner over the past three years,
rising +18.6% compounded annually vs +15.2% for the S&P 500. Markets don't move in a straight line, and neither has the relative outperformance of equal weight. The past quarter has seen a sudden reversal, with the capweighted index striking an impressive
comeback. Below, the chart outlines both the relative outperformance over the past three years as well as the sudden bout of underperformance last quarter.

So far this year, markets have returned to their old ways. Rising rates are less of a worry, and a large injection of
stimulus has also propelled big tech stocks higher. From an attribution standpoint, lack of tech exposure is by far
the largest driver of recent underperformance. On top of that, security selection within the Banks has also
negatively impacted equal weight. Year to date, the increased exposure to regional banks rather than being heavily
tilted to the large money centers has lost nearly 80bps versus cap-weighted. Performance depends on your
timeframe. Equal-weight outperformed in the last 3yrs, while market-cap weighted did better over 5yrs. Long-term
data going back to 1990 shows a virtual tie between the two, but coming off of the 2000 tech bubble, the equal
weight index has compounded annual returns of +8.6% versus +6.7% for cap-weighted.
Final Thoughts
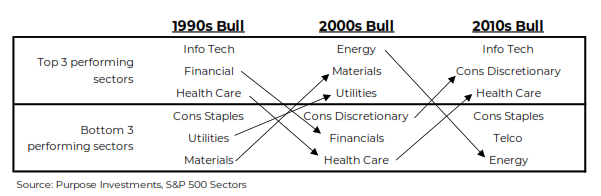
Leadership in the stock market tends to change from one bull market to another because different sectors and
industries experience varying degrees of growth and decline. The chart below gives a few excellent examples of
how often the previous leaders become laggards in the next bull. During the dot-com boom of the late 1990s,
technology stocks were in high demand, while during the 2000s, bull energy and materials tended to outperform.
Investors need to be vigilant and adaptable to capitalize on changing market trends and leadership. If you believe
things are going to change, market cap isn't really where you want to be, as it's just overweighting previous
leaders. A return to more value-oriented exposure and away from mega-cap tech stocks will also benefit equal
weight.
Despite the recent rebound in technology shares, we stand behind our call to limit exposure to the sector. We're
entering a global economic slowdown, and there is still plenty of remaining froth in tech stocks. We're likely in a
higher for longer rate environment, and growth stocks were massive beneficiaries in the low-rate world. The lowrate
world was extremely beneficial for growth investors, and momentum, in particular, was a dominant factor for long periods
over the past decade. In contrast, value was decidedly out of favour.
The current market environment emphasizes the importance of active decision-making in investment allocations.
Equal weight investing provides a potential solution for investors seeking to diversify and avoid concentration
risk in market cap indices. It's essential for investors to understand their exposures and actively manage their
portfolios, even when it comes to something as seemingly straightforward as their exposure to U.S. equities.

Share this Blog