
Conflicting Forces
Conflicting Forces
In the heart of every market lies a fierce clash between bulls and bears, where optimism battles pessimism and greed contends with fear. Buyers and sellers engage, and their sheer will is one of the most important factors driving the markets. The market itself is a complex ecosystem with many players, but at the end of the day, it’s fear vs greed that is a fundamental aspect of market dynamics. For every transaction, there is a buyer and a seller. The bulls are greedy and optimistic about the future growth outlook. The only reason they are buyers is that they expect to sell at a higher price. In contrast, the bears are a dour bunch. They’d rather sell now and get back in at a cheaper price.
This battle reflects the constant struggle between optimism and pessimism. As investors, we all know it well. Driving these emotional swings are market fundamentals, economic indicators, and geopolitical events, just to name a few. It's an essential aspect of price discovery, but drives volatility and creates opportunities for investors. At any point in time, there will always be
conflicting signals, either pushing markets higher or pulling them lower. Table 1 below summarizes just a few of these conflicting forces.
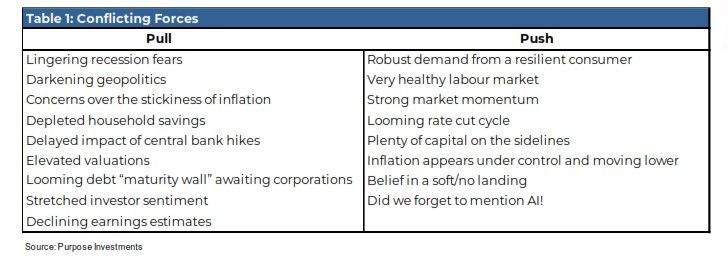
The dynamics of these forces, and which one is perceived as stronger, often create contrarian opportunities for investors. When market sentiment becomes excessively bullish or bearish, it may present opportunities to take the opposite stance and capitalize on potential market reversals. Embracing and effectively navigating conflicting signals can enhance investors' ability to achieve their financial goals in an ever-changing market environment. Unfortunately, reading the tea leaves is often more of an art than a science.
A clean slate
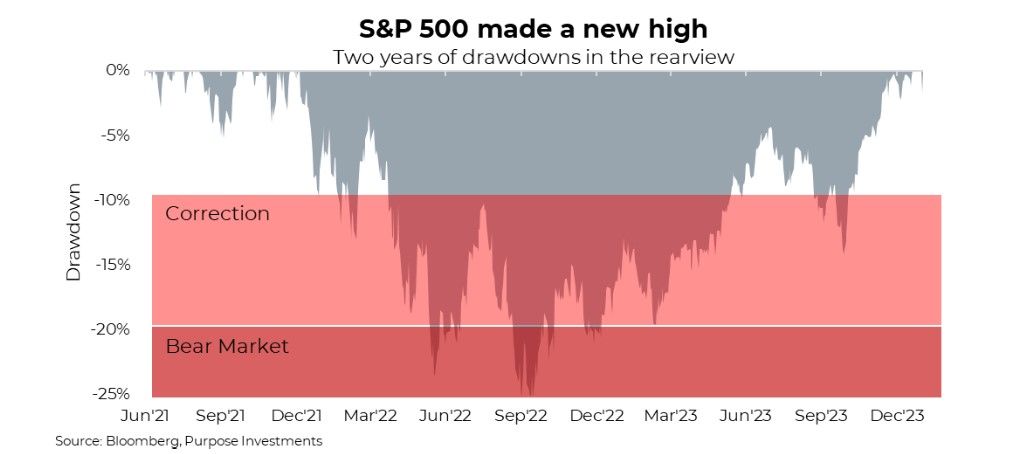
A week ago, the S&P 500 cracked through to a fresh record high. It took a total of 513 trading days to make the round trip. 195 days for the market to fall 25.4% and bottom on October 12th, 2022, and 318 days to claw its way back to the previous high water
mark struck just over two years ago. It then went on to set several higher highs in January. Despite the conflicting forces, the market has continued to run like a juggernaut. The historical precedents are promising. Forward returns are pretty decent on average after striking an all-time high, especially following such a long period between highs. Usually, once a new level has been hit, markets tend to cling to it. For those with cash on the sidelines waiting for a decent pullback, patience has not been a very profitable virtue. So, what do we expect next year:
The S&P/TSX Composite continues to lag but is a mere 4% away from its previous high set in early 2022. The NASDAQ, which continues to get most of the attention, rightfully so, thanks to its 53% rise from the depths of the 2022 selloff, is just 3% from its highs. Large-cap is winning over small once again; the Russell 2000 is still 20% below its 2021 peak. It would seem that there is a party in the market, but not everyone is invited.
Even the most ardent optimists have reason to be twitchy. Year-to-date attribution for the S&P 500 is quite thin and top-heavy. Most, if not all, of the heavy lifting is thanks to big names such as Nvidia, Microsoft, and Meta. The Magnificent 7 is getting culled, with members getting kicked out of the saloon. Tesla is down 26% YTD, Apple is negative and so is Alphabet following earnings.
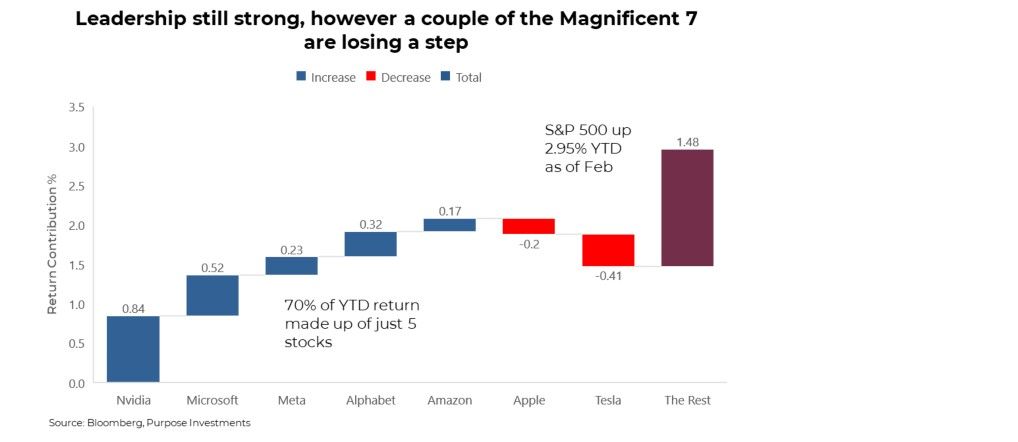
The narrow breadth of a top-heavy market is not necessarily a problem. It is certainly not a brand-new phenomenon. But it does pose several challenges. We’re seeing concentration risk in action, and investors should be keenly aware of how quickly the positive tone can unravel.
Doves flying the coop
At the close of 2023, bond yields eased, and equities had a broad-based rally. The overwhelming narrative is that peak rates are in the rearview mirror, and markets were looking forward to a cut. It still seems like markets got a little ahead of themselves with this excitement. We’re in the plateau period of a rate hiking cycle. The plateau can continue for some time and is usually when previous hikes catch up to the economy and wallets of consumers.
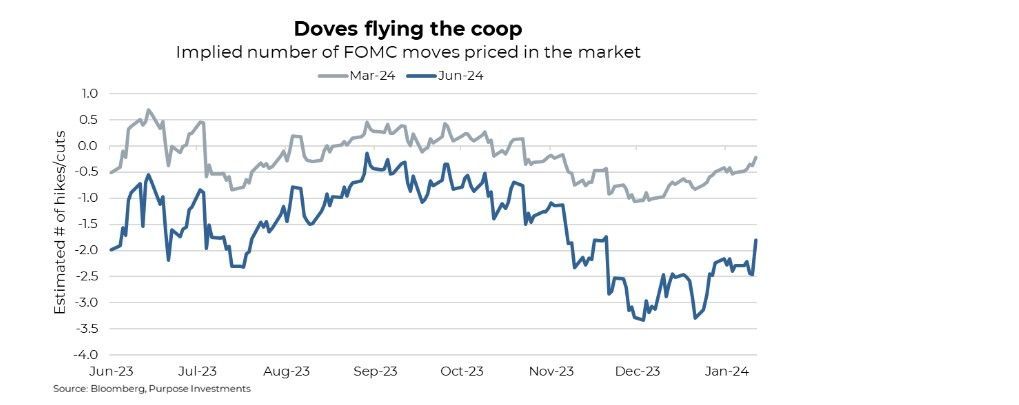
Currently, there is a 66% chance of a rate cut in May and an 87% chance in June. The market is in the process of severely dialling back and delaying the cut timeline. It’s changing by the day. At the beginning of the year, the market was pricing in an 84% chance of the first cut happening in March. The odds of a cut in March have been all but eliminated by the market. It was trending in that direction, but Powell’s post-FOMC conference all but eliminated that chance. The first cut will likely be in June. The chart below shows the doves taking hold of the market from October to December but losing control at the turn of the year, with
rate-cut expectations being pushed further ahead.
Investors and analysts have been obsessed with guessing when and how many times the Federal Reserve would finally cut interest rates. All the guesses and market odds were largely wrong—and will probably continue to be. That doesn’t change the fact that these expectations have great power and have the ability to move the market.
Why cut when the economy seems to be doing better than expected, even with rates at current levels? For one, inflation does not seem to be a primary concern anymore; inflation swaps have fallen to nearly 2%. Inflation expectations are markedly lower than they were over the past few years. If the Fed were to keep rates where they are, in “real” terms it effectively means policy has continued to tighten the past few months. This isn’t necessary, as inflation is moving in the right direction. Politics, of course, also enter the conversation, with it being an election year in the U.S. Not to say anything about the Fed’s credibility, but we’re sure this enters the thought process. In their own words, rates are “sufficiently restrictive,” and a few rate cuts don’t mean they are afraid of a recession; it’s simply a return to what they view as a normal policy rate or R-star. They will, of course, carefully assess incoming data, the evolving outlook, and the balance of risks.
Expectations for the Bank of Canada are similar. They will remain quite restrictive for much of this year. Following the Fed is likely, but perhaps a few months delayed if inflation pressures ease as expected. Should the economy continue to slow, the cuts would be pushed ahead. Cuts, in this instance, would not be good if it were due to signs of economic distress.
From our perspective, the greatest peril right now is the assumption of a seamless transition or perfect landing factoring into market valuations. The markets have sailed full speed ahead; however, they might not have charted the waters for anything but smooth sailing. The data decidedly remains mixed; there are green shoots and darkening clouds. Markets remain focused on the positive for now. Even the credit market has seen spreads setting new lows at the end of January. The bond market is near sanguine, with the lowest credit spreads since the last time the S&P 500 made new highs.
However, our base case still points to a probable recession in 2024. If we put our Bayesian thinking caps on, the probability of this outcome is fluid and shifts as new information becomes available. The Teflon consumer has, for now, resisted any lingering residue from higher rates to sap demand. The economy can change quickly, as we’ve seen many times in the past. Below, we delve into the current earnings season to assess trends and what they mean for investors.
Earnings – paying up for poorer quality
Paying up for poorer earnings doesn’t seem like the optimal investment strategy. Regardless, that’s what investors are doing at the moment. Valuations for the S&P 500 are quite elevated. Looking back in history, valuations have been higher a few select times. But we’re talking about the highest valuations in the last 20 years, except for the post-Covid period, where earnings were still depressed, rates were at rock bottom, and QE was flowing like Niagara Falls.
At present, just under half of members of the S&P 500 have reported quarterly results. Including all of the Mag 7, which, by and large, posted broadly strong, but not blow-out results across the board like some of the stock prices would have suggested.
At this stage in the earnings season, the overall performance of the market continues to be sub-par. 230 companies have reported 4Q results. Reported sales growth has been +3.4% and earnings +4.0%. Despite the slow growth, we continue to see positive surprises generally across the board. Price action is arguably more important than actual stated results, and despite a +7.1% aggregate earnings surprise, the average 1-day price movement is just 0.1%. Suffice it to say that, on average, the market has not been rewarding the beats, but it has been punishing those who have missed.
Eight of the eleven sectors are reporting earnings growth, led by Communication Services, Utilities, Consumer Discretionary and Technology. Energy, Materials, and Health Care are thus far reporting fairly significant earnings declines. Looking ahead, analysts are calling for earning growth of 9.6% in 2024 and a whopping 13.0% in 2025. Headline EPS estimates for 2024 are, however, trending lower, down nearly a percent over the past few months. The abrupt shift in the 3M revision a few months ago conflicts with a massive surge in stock prices to close out 2023.
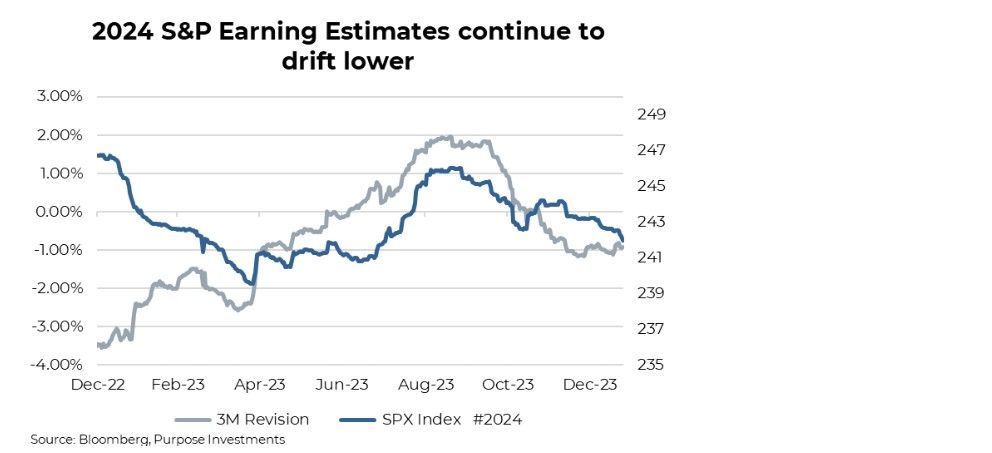
Markets didn’t take well to some of the big misses, including Microsoft and Google. Add in Powell’s unclear messaging during the FOMC conference, and markets saw a sharp reversal to close out January. Though analysts remain rather optimistic, they continue to dial it back. It appears falling inflation might be good for rates but not for earnings.
Broad themes & guidance
Recession fear has receded, and mentions of the dreaded ‘R’ word have been falling for the past few quarters. Another clear trend is the lack of mentions of inflation and interest rates. We’re seeing some lingering concern regarding commercial real estate, notably from some U.S. regional banks. Pandemic darlings continue to struggle (anyone interested in buying another spin bike for their basement?). One company in particular could really use the sale. Markets were looking for confirmation of sunnier times this earnings season, but, by and large, based on the guidance changes, companies on aggregate have missed the mark.
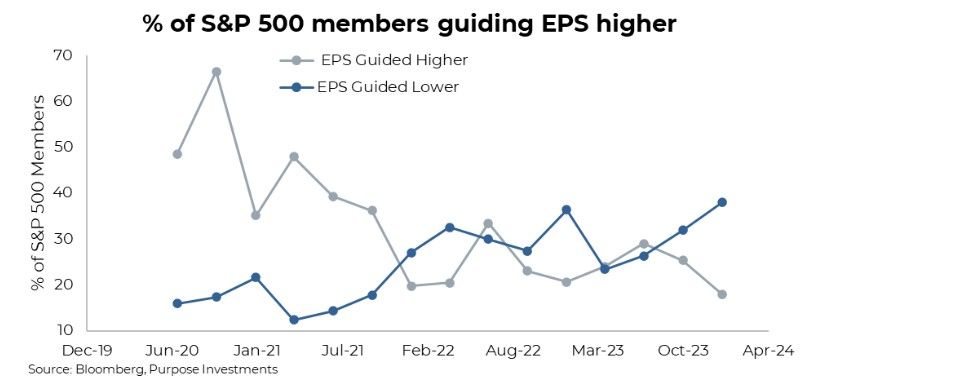
The number of S&P 500 companies issuing negative earnings per share guidance for the first quarter outnumbered those issuing positive guidance. In the chart below, we plot the trend of higher and lower guidance revisions over the past few years. With just 18% of companies guiding higher versus 38% guiding lower,˙ the ratio is now over 2-1, the highest we’ve seen over this period.
The Silent Winner
“Is Value Investing Dead?”... “The Demise of Value Investing”... “Value investing is struggling to remain relevant.” These are all headlines from the end of the decade after an incredibly strong period for growth stocks. Many would say that investors were happily dancing on the graves of value stocks as their portfolios climbed beyond their wildest beliefs. The media narrative has not changed much since the beginning of the new decade. Technology commentary continues to dominate the media headlines, and who is to blame them? The growth potential for A.I. is much more exciting to learn and read about than the fundamentals of CocaCola.
Investing in fundamentals has never been loud or exciting, but it has provided consistent returns over long periods of time. Over the last three years, we were aware that value was having a strong run, likely somewhere near growth equities, but growth was
likely winning due to AI, tech dominance, chip shortage, etc. While the narrative in the media may not have changed, the shift from growth to value has already begun. When discovering it was strongly opposite to what we believed, we decided to survey 31 financial professionals who deal with high-net-worth families throughout Canada. Our thesis was correct; even though value has
dominated the three-year period, a majority (71%) of financial professionals believe growth has been the stronger factor.
This is to no fault of the investor; there are many behavioural biases at play here, with the most dominant one being the ‘availability bias,’ also known as ‘recency bias.’ Our recent encounters with investing, especially over the past decade, and exposure to media content have heavily leaned towards discussions of growth. This has left the door wide open for value investors to quietly outperform. Given the inherent biases in investing, it is crucial to remain steadfast in your convictions and resist anchoring to media-driven narratives.
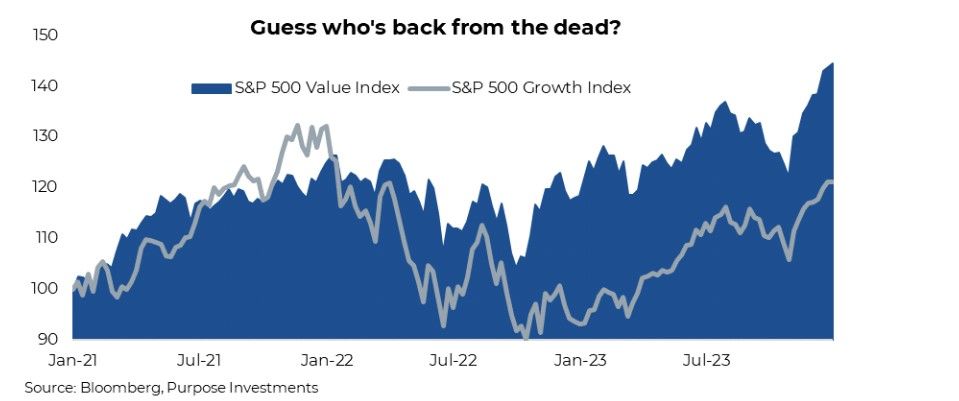
While the three-year view looks very strong for value (S&P 500 Value +44% vs S&P 500 Growth +21%), in two out of the three calendar years below, growth has outperformed value. Not by as much as you might think, but growth did outperform. 2022, the year rate hikes began, was a big reason for the outperformance over the period, with value outperforming growth by 24% (S&P 500 Value -5% vs S&P 500 Growth -29%). But that is what value is meant to do; when you get this larger pullback in the market, your blue-chip value stocks should hold up better. Lucky for us, calendar years are arbitrary; as long-term investors, we are focused on exactly that – the long-term – and this type of portfolio construction is proving to be beneficial given the current market environment.
For much of the current decade, we have been consistently overweight value, most notably in the realm of US equities. While the positioning has been successful thus far, the primary focus should be on what will happen in the future. There are a few key reasons that lead us to believe there will be continued outperformance of value.
Sustainability
The sustainability factor comes down to good old-fashioned diversification. Unsurprisingly, approximately 90% of the return for the growth index throughout these three years can be attributed to one sector: Technology. Flipping over the value index, to achieve the same 90% coverage for return, you must include the top seven performing sectors of the index. While there are certainly differing opinions in the investing world, there is likely a preference for investment growth to be diversified amongst seven sectors rather than depending solely on a single one. This type of investment growth does not feel particularly sustainable over the long run.
Valuations
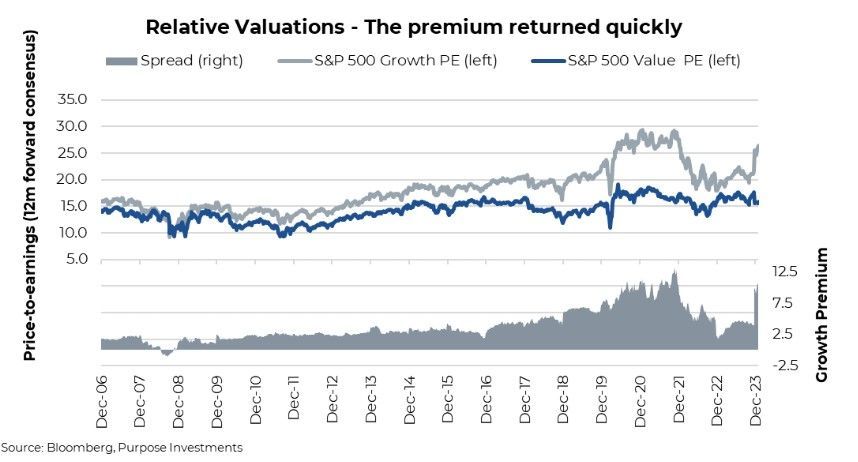
Simply put, the US growth index is expensive, and as we learned in the last Market Ethos (Do Valuations Matter?), the more expensive the index, the lower the forward returns have been historically. The growth premium has made its way back to nosebleed levels last seen in 2021. While the markets did move much higher throughout Q4 of 2023, mainly due to multiple expansions, price does not entirely explain the quick shift in valuations that we saw at the end of December. The more impactful explanation for the return of the growth premium comes down to forward earnings estimates. The earnings estimates for growth companies in the S&P 500 pulled back while the forward earnings estimates for value in the S&P 500 strengthened. Therefore, a significant amount of the P/E growth premium climbing has to do with the “E” moving in opposite directions for both styles. We expect that trend to continue as some of the earnings estimates for the growth companies were/are certainly extended.
Higher inflation & rates
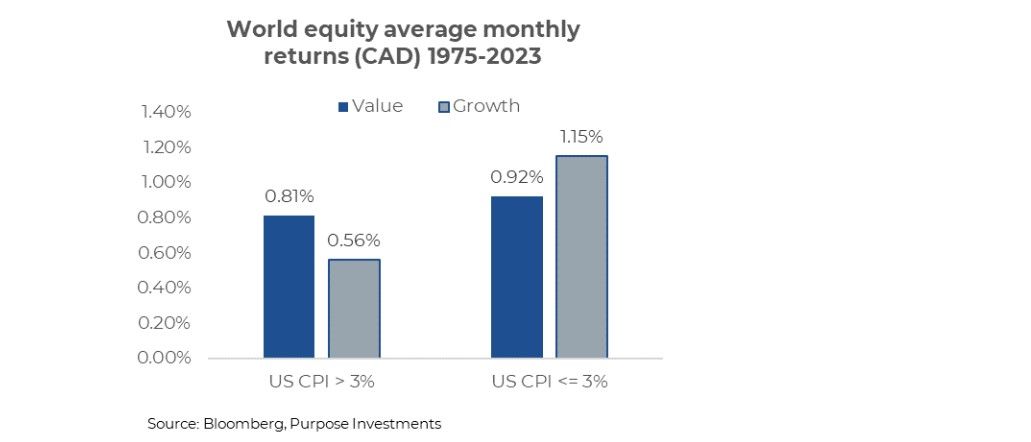
While the current inflation level has come back down, our view is that it will continue to flare up through the cycle and, on average, remain at higher levels than the last cycle. Looking back over the last 48 years, this has proved positive for the value factor. There was roughly the same number of periods when US CPI was greater than 3% as there was when CPI was less than 3%. Separating those two periods, value stocks outperformed on an average monthly basis by +25 bps in periods where US CPI was greater than 3%. The opposite can be said for periods where US CPI was less than 3%; growth outperformed value by +23 bps.
During a period of rate cuts, we can expect growth to outperform value. However, if inflation proves more volatile over the long term, so will the rate environment, meaning we may not be going back to the depths of interest rates. A more consistently elevated rate environment should prove to be a boon for value.
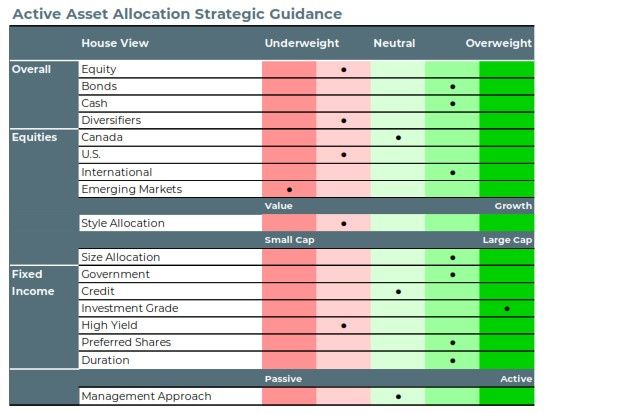
Recognizing new cycles early on is crucial for maximizing future returns. After a decade of underperformance in value, the time for value investors may have arrived. While the U.S. equity market has distinct value and growth factors, other markets, such as the TSX and international markets, appear value-heavy based on current valuations. This forms the basis for our underweight position in the growth-heavy U.S. market, market-weight in Canada, and overweight in international equities.
While we acknowledge the possibility of mixed performance between value and growth for the remainder of 2024, our preference leans towards value, aligning with our forward-looking strategy. Our stance doesn't imply a complete dismissal of the growth factor. We remain cautious about potential challenges, such as a recession, where growth may exhibit some resilience. However, our focus is on anticipating future trends, and currently, that points towards a value-oriented approach. Spread the word – value is on the rise, and we aim to keep this momentum for the dedicated value investor.
Portfolio Positioning
We continue to hold a portfolio position that we would characterize as moderately defensive. Bit of an overweight in cash, not
lured by the attractive yield, but more so for optionality. Our expectation for equities is tepid. The market is currently pricing in a
rather goldilocks scenario of a soft or no landing for the global economy with a potential lift from rate cuts. We don’t think it
will go that smoothly and have extra cash to buy on weakness. In the meantime, we are getting paid a decent amount to park.
On the bond side, we are moderately overweight. The current yield is attractive, and most bonds remain trading at a discount
to par, which should equate to a bit more upside as they gradually move closer to maturity. And since our base case is for economic weakness internationally to spread to North America, we do believe yields will grind lower, even after the decent drop since publishing our outlook in early December. From a duration perspective, we are just over 5. This is about the highest duration we have had since starting to manage multi-asset portfolios in 2015. Our credit exposure is light, as we believe spreads are not providing much of a safety buffer in case the economy does weaken and defaults rise.
On the equity side, we do remain moderately underweight in U.S. equities, which has not been the right call for the past year. However, offsetting this has been an overweight international with an emphasis on Japan. Japan is quickly becoming the talk of the town based on reports and articles; we were there over a year ago. We continue to be underweight emerging markets which has been a positive tilt for the portfolio, however, we have recently become a bit more intrigued.
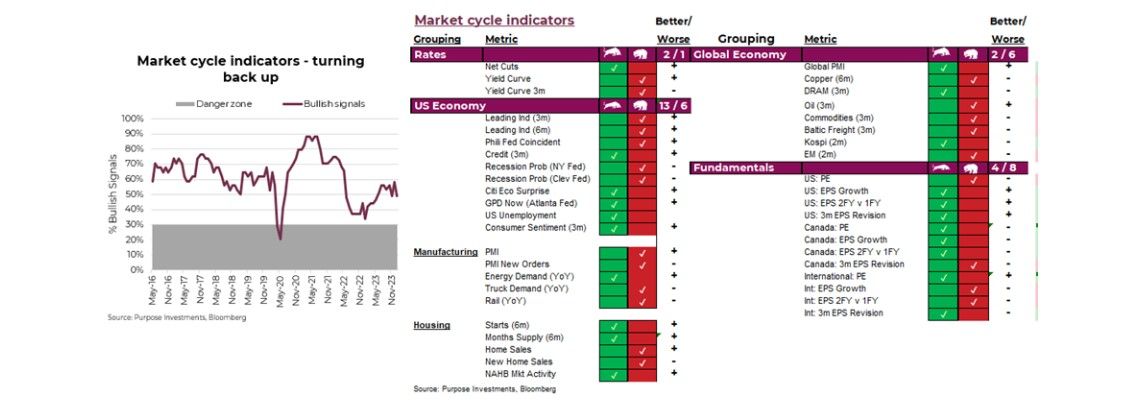
Market cycle indicators remain stable on the lower side of healthy or neutral. We can never know fully what the future holds, but certainly down here does warrant a bit more defense.
Sticking with the party terminology, we are at the party, standing near the door, sipping a light beer.
The Final Word
The market's ongoing battle between optimism and pessimism, represented by bulls and bears, remains a driving force in the financial world. Investors navigate conflicting signals, concentration risks, and the recent shift in interest rate expectations, all within a market that, while hitting record highs, potentially overlooking forthcoming challenges. As uncertainties persist, staying vigilant, agile, and open to contrarian opportunities becomes paramount. The delicate balance between fear and greed continues to shape the market's trajectory, highlighting the need for investors to adapt to the ever-evolving landscape.
Source: Charts are sourced to Bloomberg L.P. and Purpose Investments Inc.
The contents of this publication were researched, written and produced by Purpose Investments Inc. and are used by Echelon Wealth Partners Inc. for information purposes only. This report is authored by Craig Basinger, Greg Taylor and Derek Benedet Purpose Investments Inc.
Disclaimers Echelon Wealth Partners Inc.
The opinions expressed in this report are the opinions of the author and readers should not assume they reflect the opinions or recommendations of Echelon Wealth Partners Inc. or its affiliates. Assumptions, opinions and estimates constitute the author's judgment as of the date of this material and are subject to change without notice. We do not warrant the completeness or accuracy of this material, and it should not be relied upon as such. Before acting on any recommendation, you should consider whether it is suitable for your particular circumstances and, if necessary, seek professional advice. Past performance is not indicative of future results. The comments contained herein are general in nature and are not intended to be, nor should be
construed to be, legal or tax advice to any particular individual. Accordingly, individuals should consult their own legal or tax advisors for advice with respect to the tax consequences to them.
Purpose Investments Inc.
Purpose Investments Inc. is a registered securities entity. Commissions, trailing commissions, management fees and expenses all may be associated with investment funds. Please read the prospectus before investing. If the securities are purchased or sold on a stock exchange, you may pay more or receive less than the current net asset value. Investment funds are not guaranteed, their values change frequently and past performance may not be repeated.
Forward Looking Statements
Forward-looking statements are based on current expectations, estimates, forecasts and projections based on beliefs and assumptions made by author. These statements involve risks and uncertainties and are not guarantees of future performance or results and no assurance can be given that these estimates and expectations will prove to have been correct, and actual outcomes and results may differ materially from what is expressed, implied or projected in such forward-looking statements. Assumptions, opinions and estimates constitute the author’s judgment as of the date of this material and are subject to change without notice. Neither Purpose Investments nor Echelon Partners warrant the completeness or accuracy of this material, and it should not be relied upon as such. Before acting on any recommendation, you should consider whether it is suitable for your particular circumstances and, if necessary, seek professional advice. Past performance is not indicative of future results. These estimates and expectations involve risks and uncertainties and are not guarantees of future performance or results and no assurance can be given that these estimates and expectations will prove to have been correct, and actual outcomes and results may differ materially from what is expressed, implied or projected in such forward-looking statements. Unless required by applicable law, it is not undertaken, and specifically disclaimed, that there is any intention or obligation to update or revise the forward-looking statements, whether as a result of new information, future events or otherwise. Before acting on any recommendation, you should consider whether it is suitable for your particular circumstances and, if necessary, seek professional
advice. The particulars contained herein were obtained from sources which we believe are reliable, but are not guaranteed by us and may be incomplete. This is not an official publication or research report of either Echelon Partners or Purpose Investments, and this is not to be used as a solicitation in any jurisdiction. This document is not for public distribution, is for informational purposes only, and is not being delivered to you in the context of an offering of any securities, nor is it a recommendation or solicitation to buy, hold or sell any security.
Share this Blog