
From Bayes to Bulls: A Probabilistic Look into Market Strategy
From Bayes to Bulls: A Probabilistic Look into Market Strategy
On any given day, markets tend to be pretty random, influenced by the daily news, an economic update or two, or even the weather in NYC (sunny days have a marginally higher return than non-sunny days… you can google or ChatGPT it). A little longer term, let’s say weeks or a month, sentiment, flow dynamics, and pre-existing positioning can have a bigger impact. Let’s call this
intermediate term. Here comes some good news: given the drop in August and September, markets are pretty oversold. Sentiment has turned more bearish, which is bullish.
Given the market has sold off lately primarily due to the sudden rise in bond yields (U.S. 10yr has risen from 4.11 to 4.58 in September), it’s easy to surmise a cooling of yields would help the equity market regain some lost ground. Or maybe earnings season. There’s no denying September is largely a blackout month when companies don’t talk much, and share buybacks are muted due to the upcoming earnings season. That all changes in a couple of weeks.
Of course, the news could get worse, bond yields could rise more, and this would extend the current weakness. In the intermediate term, there is a bit more forecastable than the short-term weather, but there’s still a reasonable amount of randomness. In the long term— we are talking quarters and years here—valuations dominate most expected return models or forecasts. And the valuation metric we are going to bring back into the spotlight this month is an iteration of the Fed model.
While there are a few different versions of the model, the one we are sharing today is the earnings yield (inverse of the PE ratio) for the S&P 500 based on consensus estimated earnings for the next 12 months. This equity earnings yield is compared to the yield-to-worst of the U.S. Aggregate Corporate Bond index. For about the last 20 years, this was the valuation model that favoured equities. Of course, there were brief periods when equities were cheap during that 20year period, such as the depths of the 2008
or 2020 bear markets or deeper corrections along the way. But for the most part, U.S. equity valuations were historically high. However, since the Fed model is comparing equity valuations to bond valuations, it’s a relative thing for these two popular asset
classes. On a relative basis, equities always looked cheap simply because bonds were so expensive (aka very low yield)for such a
long period of time. It was this kind of model that encouraged the phrase TINA – There Is No Alternative.
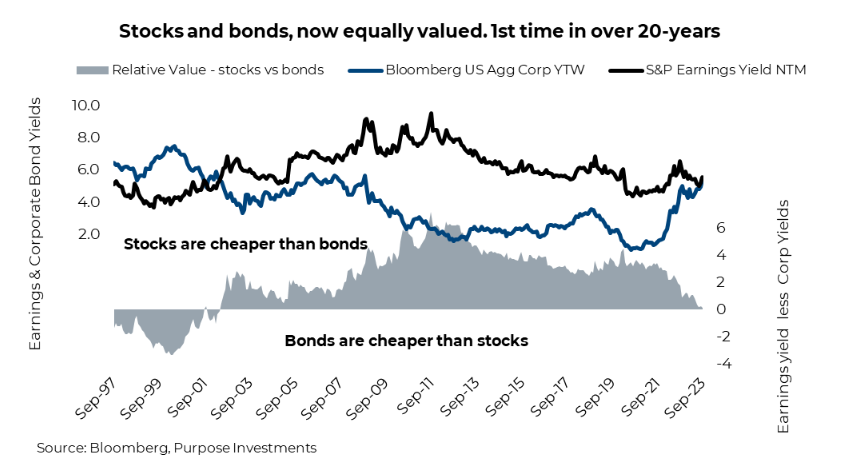
This month that relative valuation lure has evaporated. Bonds are now a mere 2% overvalued compared to equities. Of note, this is the lowest relative valuation for bonds since 2001. Remember, this isn’t saying either bonds or equities are a screaming buy or cheap; instead, from this valuation metric, they are now pretty close to being fairly ‘relatively’ valued.
This doesn’t mean bonds can’t go down more, or stocks for that matter. Simply, stocks just don’t have that relative valuation argument they have enjoyed for so many years compared to bonds. Or perhaps a more helpful way to phrase it is that after 20 years of being overvalued, bonds are back to being fairly valued.
What’s your style?
No, we’re not talking fashion. Frankly, it’s a combination of amusing and exhausting to keep up with all the “cores” in the streetwear scene. The latest we’ve heard about was GORPcore (GORP – Granola, Oats, Raisins, Peanuts), which explains the plethora of Patagonia and Arc'teryx venturing about downtown Toronto streets with not a mountain in sight. Investment style is much more interesting to us and important. Like fashion, the choice tends to be deeply personal. Value and growth sit on opposite ends of the style spectrum, with each striving for the same end goal. Alpha generation. Astute investors like fashionistas can find ways to deftly navigate between styles with the ultimate pursuit of standing above the crowd.
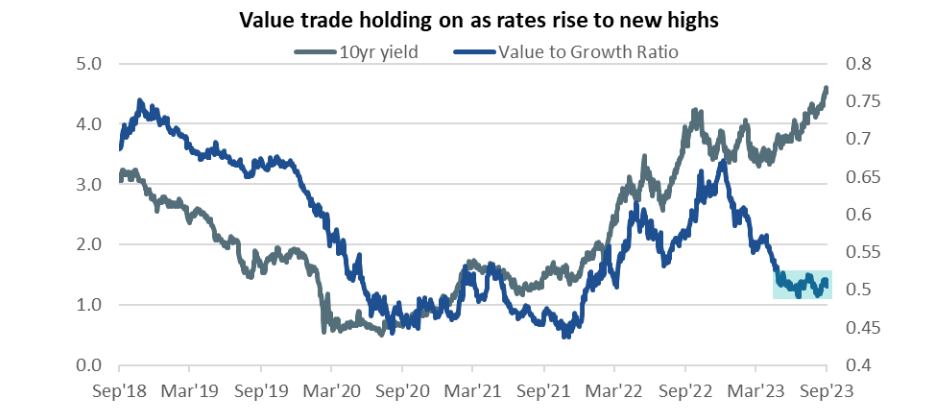
After getting trounced in the first half of the year, value stocks are beginning at least to hold their own. They aren’t leading the market by any means, but value has been keeping up with growth over the past few months. Below, we’ve plotted the ratio between the Vanguard Value and Growth ETFs. The rates-driven relationship really broke down earlier this year, but the ratio line has broken out of the downtrend that dominated the first half. We’ve yet to see any real outperformance from value, but there is a nice setup forming. Technically, if these can get through the recent highs, it would signal a breakout into what could be a positive trend for value. It’s definitely something we’re keeping an eye on here.
Valuations
From our perspective, the valuation gap between both factors is a key determinant of which one is more attractive. Growth should be more expensive, but it’s the degree of expensiveness that’s important. At present, growth is still trading well above its average premium to value. It is not quite as extreme as it was at the previous market peak. However, the spread is wide enough to believe that there is both less downside risk in value should multiples contract and potentially more upside should multiples normalize. From this perspective, it’s a bit of a win-win scenario. However, earnings also matter. A recession or even a slowing
economy could be good for growth when any growth is scarce or longer duration assets if this also drives yields materially lower. much of the value space is also quite rate-sensitive. Value/dividend stocks have gotten punished, with bond yields moving higher. Falling yields, coupled with earnings uncertainty, could drive demand for safer, mature, stable companies.
Know your product
Quite frankly, it’s complicated when it comes to allocating capital across funds in multi-asset portfolios. One of the key tenets is to know what you own. You have to understand your exposures and delve into the underlying holdings of any fund to get a deep understanding of exactly where the risks and opportunities lie. Factor exposures are no different. An easy way to generate factor tilts within a portfolio is simply to buy funds or ETFs that tilt heavily toward those factors. Any fund company can slap value on a fund, but that doesn’t necessarily mean it is truly a value fund. There is no shortage of products specifically designed to isolate any number of factors, whether they be value, growth, quality, size momentum, etc. Digging into the managers, methodologies, and exposures is really the best way to see if they are a robust offering.
Stylistic Differences
The stylistic differences between value and growth are perhaps the starkest among popular factors. In the analysis below, we compare and contrast baskets of the largest U.S.-based Value and Growth ETFs. Fund manufacturers all have slightly different methodologies to get their desired factor exposure, and there are slight differences between them. There is no right answer, so we’re simply looking at the three largest in each category.
True to their name, value ETFs have lower valuations. But they also have significantly lower average and median market caps, higher dividend yields and significantly lower concentration risk. The average weight of the ten positions for the value basket is just 22.6% versus 49.8% for the growth basket. For reference, the weight of the top ten largest stocks in the S&P 500 is 30.4%. We view this concentration risk as material; even for the overall market at 30%, the concentration risk among the growth ETFs is magnitudes higher.
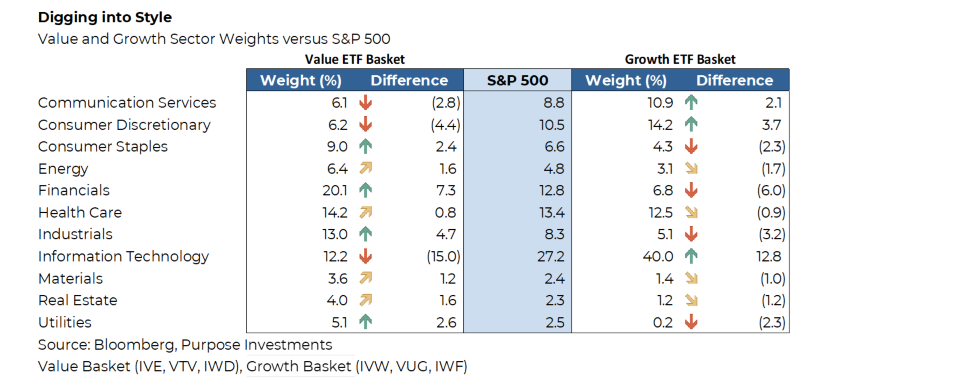
Besides the stylistic differences, the real distinction lies in the sector exposures. The table above compares the difference in sector weights for our funds under analysis compared to the S&P 500. These Value ETFs tilt heavily toward Financials and Industrials in particular while also overweighting Utilities and Staples. Growth, not surprisingly, is heavily geared towards Technology as well as Discretionary. There are some differences between these products. Health Care, in particular, is a little all over the map. But the general theme that jumps out is that if Tech is going to do better than Financials, then Growth will win every time. When the
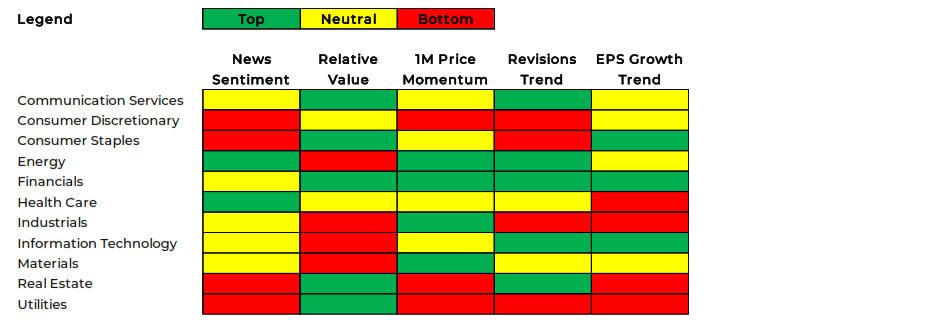
Banks are doing better, it’s a sign that Value funds are likely outperforming. Below, we’ve compiled a sector heat map pulling together sentiment, fundamentals and price data across the sectors. While we’re not particularly bullish on the banks given our macro view, it is surprising to see Financials scoring well across the board.
Portfolio Implications
Heading into Q4, we’d prefer not to chase the growth outperformance this year. In terms of any definitive style tilt, the increased diversity, superior relative value and, don’t forget, dividends, have us leaning towards value in our multi-asset portfolios. We still see elevated risk in Technology names. The rates duration stocks argument is going for the kill once again. The year’s been interesting because tech/growth were doing exceptionally well up until a couple of months ago. This period also saw US 10-year yields rise from 3.5% to close to 4% again. Incoherence can cause some beliefs to go extinct. The rates/duration argument was played to death in 2022, but somehow forgotten rather quickly for most of this year. Rates moving in one direction or the other are not the only variable. Rates move for a whole host of reasons: changes in economic growth, sentient shifts, the U.S. being downgraded from AAA, inflation expectations, etc. If rates are rising because growth expectations are rising, this can be good for growth stocks. If they are rising for other reasons, then this is decidedly less good for growth.
Hard, soft or no landing at all
When it comes to investing, it is often best to think like a Bayesian. Bayes’ theorem and other related frameworks are all about thinking in probabilities and updating those probabilities based on new information. Of course, everyone would prefer certainty, like “the market will be higher in 12 months”, but that just isn’t how the world works. The future is uncertain; nobody really knows where we will all be in a year or the path to get there. And, as more information becomes visible along the journey, the scenarios and probabilities of those potential paths change.
One of the greatest benefits of thinking like a Bayesian is how it handles uncertainty as it encourages the adoption of new information. This is often the blind spot for investors. It is very easy, once a view is formed, to become entrenched. Confirmation bias lures all of us to focus on information that supports our view and discard information to the contrary. Obviously, this can be a danger, notably when real change is afoot.
At the onset of 2023, we had a positive view of equities. Valuations had become more appealing after the price declines of 2022, and we believed inflation would grind lower. Given inflation was the biggest angst for markets, this would fuel a reprieve rally. However, we did believe as inflation fell, earnings growth would suffer, and the economy was at risk of recession later in the year. The depth of the recession was very uncertain. A healthy global consumer was a positive, as was China's reopening. The higher cost of capital and a falling wealth effect due to declines in 2022 were the big negatives.
This had us looking for a bear market rally, but with recession risks rising for something in between a hard and soft landing. Bumpy landing may have been the term we used. Reflecting back on notes, analysis at the time and our past reports, our probabilities would have been something like 50% Hard Landing, 35% soft and maybe a mere 15% no landing.
When talking about probabilities, you must also give a timeline. Without a timeline, one could just say there is a 100% chance of a recession….and never be wrong. Since this was a 2023 outlook report (HERE if you want to reminisce or read supporting evidence for the view), let’s say our timeline was for the calendar year.
Fast forward to the end of September. Inflation has come down. The market did enjoy a relief rally that proved to be larger and longer than expected. More so for the U.S. and international developed markets. Meanwhile, the economy proved more resilient, pushing the recession risk further out.

The probability of a hard landing for the economy in 2023 has clearly diminished. We’re not saying there isn’t weakness; there is in many categories, such as global trade, manufacturing, China risk, etc. However, the consumer has endured thanks to accumulated savings, a decent job market and wage growth, enduring higher credit costs and higher inflation… so far. But as we near 2024, the risks have actually grown. Yields and cost of credit have moved significantly higher, along with higher energy costs. And the accumulated buffers appear to be diminishing at a pretty quick pace.
In totality, this has pushed the economic risk into 2024. But alas, we don’t invest in economies; we invest in markets such as stocks, bonds and commodities. And while these asset prices are certainly tethered to the economic cycle, their gyrations are often influenced by other factors as well, especially in the short term. In the following Market Cycle section, we will incorporate this framework for a number of key markets to further increase the transparency of our thinking and portfolio positioning.
Market Cycle, Positioning, Probabilities (conviction)
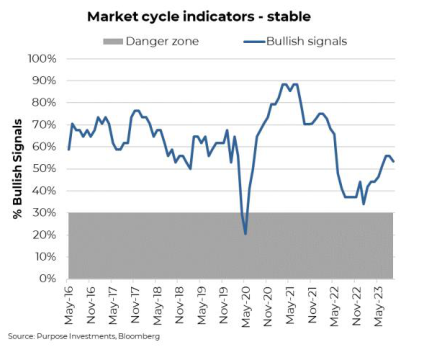
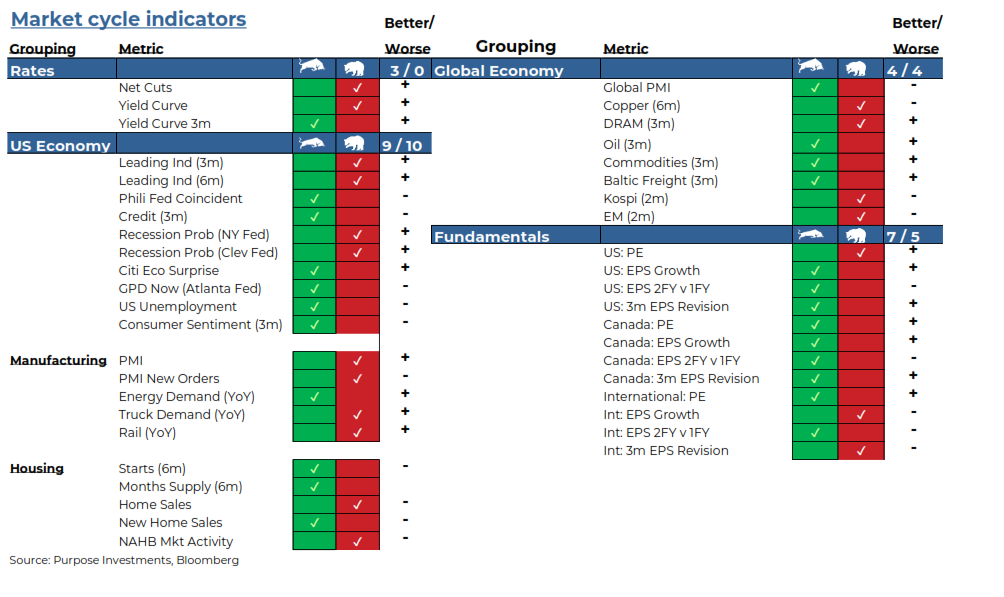
Market cycle indicators ticked down a bit this past month but remain in relatively neutral territory. One metric improved on the global economic front, but two switched to bearish for U.S. Housing. The U.S. housing industry has certainly entered a rather challenging period. Home prices remain stable, yet existing home sales have fallen to levels not seen since the depth of the housing crisis. High mortgage rates have removed both buyers and sellers from the market, resulting in activity tilting towards new builds. Those new builds are being discounted, given higher financing costs, so it will be interesting to see when or if this spreads to existing home prices. Mortgage rates over 7% are starting to have a bigger impact.
The forward-looking yield curve, leading indicators, and recession probabilities remain bearish. Yet, current activity is
more resilient. Pretty much the same old story of the past few quarters. Earnings season, which kicks off in a couple of
weeks, will be interesting. Higher interest expenses and cost inflation (wages + other costs) are evident across corporate
income statements. But inflation that remains somewhat elevated still offers some top-line revenue growth to
compensate… for now. Corporate America has proven well adapted to navigating these macro trends, and given the small
number of companies that report early given non-calendar year-ends, things look similar to past seasons so far.
Portfolio Positioning
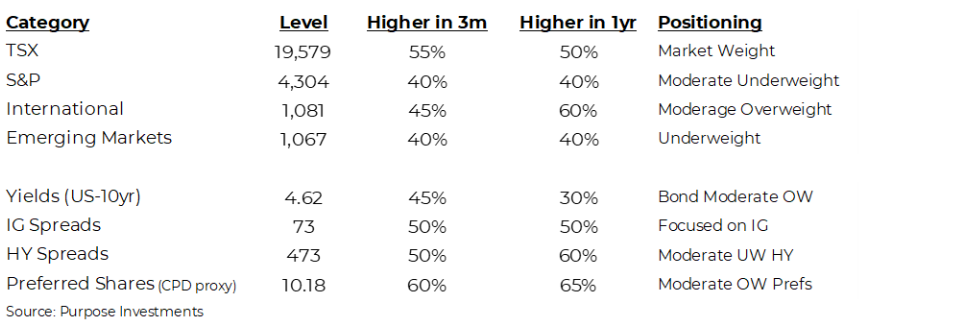
In terms of portfolio positioning, we’ve made no changes this month. After becoming more positive on preferred shares in August, our portfolio position remains unchanged. We remain slightly defensive in equities, preferring safer vehicles with an affinity toward dividend-yielding shares. We remain overweight international. Within the fixed income space, we prefer the safety of investment grade bonds and government debt, believing the risk/reward trade-off in the high yield space is not yet tilted in the investor's favour. Despite the continued sell-off in emerging market shares, we’ve yet to even dip our toe into this asset class. Within alternatives, we prefer real assets and defensive strategies.
Probabilities
Markets have come down in August & September as bond yields have risen (aka bond prices down). The impact of higher yields has quickly translated into lower valuation multiples among equities, achieved by falling prices. Now, the question is how these higher yields impact other market aspects. Risks are certainly elevated. There is a renewed debt ceiling debate, and the economic data remains too warm for the market’s liking. Yet we could also see yields come back down as they are short-term overextended, which would likely fuel a bounce back in equity markets. Helping the probability of this scenario is seasonal factors. Markets often experience weakness in September and into early October, followed by a season period of strength.
Earnings season may go well, as has been the trend. However, we would note that future earnings growth expectations remain too high in our view, and this is a risk in 2024.
The table below is a synopsis of some of our behind-the-scenes debates, analyses, and even arguments. We hope this provides some added insight into our process but also into our conviction on current positioning. This will become a standard component of future updates so we can all monitor changing views, opinions and, of course, positioning.
The Final Word
Moderately defensive is how we would characterize our positioning as we enter the final quarter of 2023. There’s enough exposure to benefit from a nice year-end advance, but we are really more positioned to navigate the mild weakness of August/September if it continues.
— Craig Basinger is the Chief Market Strategist at Purpose Investments
— Derek Benedet is a Portfolio Manager at Purpose Investments
— Brett Gustafson is an Analyst at Purpose Investments
Source: Charts are sourced to Bloomberg L.P. and Purpose Investments Inc.
The contents of this publication were researched, written and produced by Purpose Investments Inc. and are used by Echelon Wealth Partners Inc. for information purposes only.
This report is authored by Craig Basinger, Greg Taylor and Derek Benedet Purpose Investments Inc.
Disclaimers
Echelon Wealth Partners Inc.
The opinions expressed in this report are the opinions of the author and readers should not assume they reflect the opinions or recommendations of Echelon Wealth Partners Inc. or its affiliates. Assumptions, opinions and estimates constitute the author's judgment as of the date of this material and are subject to change without notice. We do not warrant the completeness or accuracy of this material, and it should not be relied upon as such. Before acting on any recommendation, you should consider whether it is suitable for your particular circumstances and, if necessary, seek professional advice. Past performance is not indicative of future results. The comments contained herein are general in nature and are not intended to be, nor should be construed to be, legal or tax advice to any particular individual. Accordingly, individuals should consult their own legal or tax advisors for advice with respect to the tax consequences to them.
Purpose Investments Inc.
Purpose Investments Inc. is a registered securities entity. Commissions, trailing commissions, management fees and expenses all may be associated with investment funds. Please read the prospectus before investing. If the securities are purchased or sold on a stock exchange, you may pay more or receive less than the current net asset value. Investment funds are not guaranteed, their values change frequently and past performance may not be repeated.
Forward Looking Statements
Forward-looking statements are based on current expectations, estimates, forecasts and projections based on beliefs and assumptions made by author. These statements involve risks and uncertainties and are not guarantees of future performance or results and no assurance can be given that these estimates and expectations will prove to have been correct, and actual outcomes and results may differ materially from what is expressed, implied or projected in such forward-looking statements. Assumptions, opinions and estimates constitute the author’s judgment as of the date of this material and are subject to change without notice. Neither Purpose Investments nor Echelon Partners warrant the completeness or accuracy of this material, and it should not be relied upon as such. Before acting on any recommendation, you should consider whether it is suitable for your particular circumstances and, if necessary, seek professional advice. Past performance is not indicative of future results. These estimates and expectations involve risks and uncertainties and are not guarantees of future performance or results and no assurance can be given that these estimates and expectations will prove to have been correct, and actual outcomes and results may differ materially from what is expressed, implied or projected in such forward-looking statements. Unless required by applicable law, it is not undertaken, and specifically disclaimed, that there is any intention or obligation to update or revise the forward-looking statements, whether as a result of new information, future events or otherwise. Before acting on any recommendation, you should consider whether it is suitable for your particular circumstances and, if necessary, seek professional
advice. The particulars contained herein were obtained from sources which we believe are reliable, but are not guaranteed by us and may be incomplete. This is not an official publication or research report of either Echelon Partners or Purpose Investments, and this is not to be used as a solicitation in any jurisdiction. This document is not for public distribution, is for informational purposes only, and is not being delivered to you in the context of an offering of any securities, nor is it a recommendation or solicitation to buy, hold or sell any security.
Share this Blog