
Moody Market
Moody Market
Markets certainly move around a lot. Last summer, the stock market rallied over a number of months into the end of July before going on a three-month decline due to rising bond yields. Then, from what were oversold levels, the market rallied for the last two months of the year. This put a cherry on top of 2023, which saw the S&P 500 gain 26% – a very impressive year.
So, where did those returns come from? The chart below decomposes the U.S. equity market performance into different components: dividends, earnings growth and multiple expansion/contraction. Of that 26% last year, 2.1% was thanks to dividends, 6.1% from earnings growth and the rest, 18.1%, was due to a rising market multiple. The price-to-earnings (PE) ratio for the S&P 500 rose from 16.8 to 19.7, about three points of multiple expansion. Hence, the red bar in 2023 is rather large, actually close to the same size in the opposite direction compared to 2022.
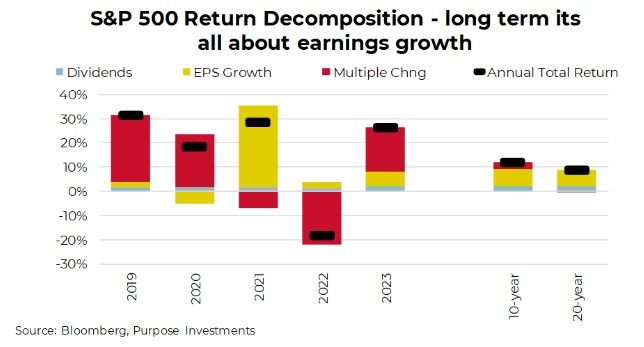
However, if you look longer term, the changing market valuation multiple quickly fades in importance and earnings growth becomes the key driver of performance, plus a bit from dividends. This makes sense as the market multiple fluctuates, given
investor optimism or pessimism about everything from the economy, rates, profits, war, elections, etc. It fluctuates in both directions and clearly exhibits mean reversion tendencies. Or, in simpler words, a PE of 20 does have a greater likelihood of declining than expanding in 2024… but of course, either direction is possible.
In 2024, there are a few things we can know with a decent amount of certainty. The total dividends paid by the index constituents do change over time, but usually very gradually. So, we are probably safe in expecting a little less than 2% returns from
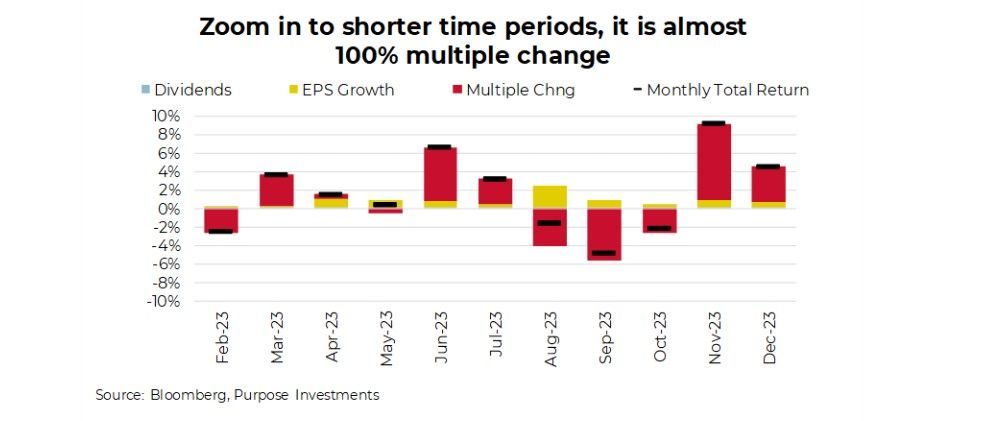
dividends in 2024. Earnings growth does tend to be more volatile and uncertain, but if we go with consensus bottom-up analyst predictions, that is 10-12% earnings growth. Add those two together, leaning on the lower end of the range for earnings growth totals about 12%. That sounds pretty darn good; of course, that implies a stable market multiple… in a metric that is anything but stable. How unstable? Well, the previous chart looked at annual return decomposition; the next one breaks it down to monthly performance. You can’t even see dividends anymore, and earnings growth is still there, but the changing market multiple dominates. Some months giving, some months taking.
If you can figure out where the market multiple is going next, ring us, and we will create a fund/ETF for you. It is really trying to gauge the mood of the market, or more specifically, the direction in which the mood is changing. From pessimism to optimism, you get multiple expansion. From optimist to pessimism, you get multiple contraction.
What will the market mood be next?
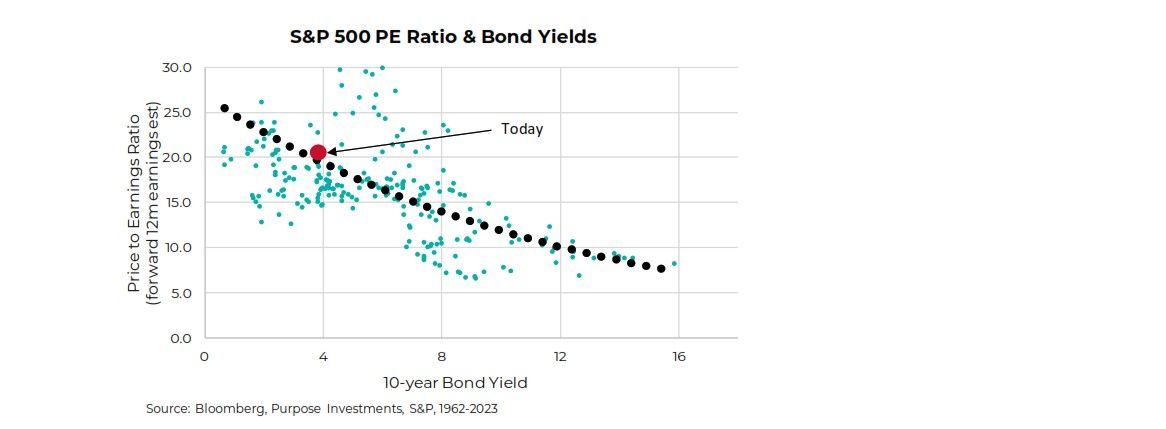
There are some fundamental drivers. Higher bond yields are historically associated with a lower market multiple. The chart below uses valuation data for the S&P 500 going back to the 1960s. While there are clearly outliers, there does appear to be a long-term relationship between bond yields and stock market valuations. This is logical; everything is a competing asset class, so if bonds are paying more, equities, to remain competitive, must offer more compelling valuations. The big red dot in the chart below marks “today,” which appears to have only slightly elevated valuations.
Yet, as we demonstrated from our monthly return decomposition chart, it is more about changing moods. In November and December, the vast majority of the market’s move higher was due to an improving mood among investors, given the multiple changes added over 10% of gains. Worth noting, during that period, bond yields, as measured by the 10-year Treasury, fell from 4.9% to 3.9%. So yields do matter a lot, but so do so many other things.
If we suddenly had peace in the world’s major current conflicts, we would probably lift the multiple. If inflation continues to decline, that would be good news. If the economic data weakens, it likely lowers the multiple. Then again, if the economic data weakens (bad), bond yields would likely fall more (good). All these things and many more are happening at the same time, making it rather challenging to guess the next directional move of the market multiple.
Not fundamentals but sentiment and positioning can provide some clues as to the more likely next move in the market multiple. For instance, if everyone is bearish due to lots of bad news, what happens next? Well, if everyone is bearish, then there is nobody left to move from being bullish to bearish, as they are all already there. So, the more likely next step would be for one of those bearish folks to become bullish. This is why sentiment is a contrarian indicator. You are supposed to buy when everyone is bearish and be a seller when all are bullish.
Gauging investor sentiment is challenging. One of the longest data sources is the AAII investor sentiment survey, which asks respondents whether they believe the stock market will be higher or lower in the next year. When this is near an extreme level, either overly bullish or overly bearish, there is, on average, a strong determinant of stock market performance. When very bearish, the average future performance is well above average, and when everyone is bullish, future performance tends to be lower than usual.
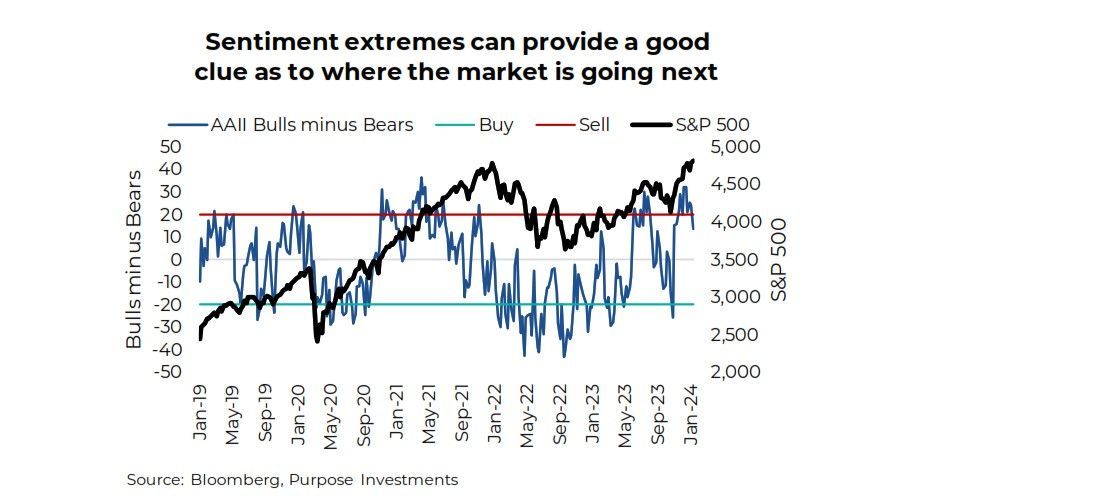
While far from perfect, when the bulls vastly outnumber the bears (above the red line), the S&P 500 has typically seen weakness ahead. When most are bearish, the future returns are much better. So, while the S&P 500 may be somewhat euphoric, trading up to over 4,800, sentiment certainly should cause investors some pause as to what may be coming next in the near term. In addition to this, valuations are certainly extended after the strong market returns of late 2023 and the lack of earnings improvement.
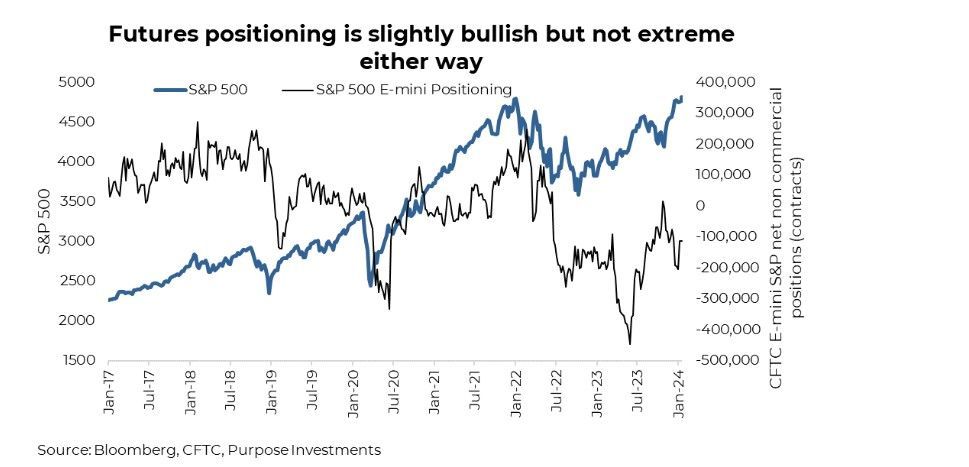
Despite investors being rather bullish (which is bearish), portfolio positioning doesn’t exactly match this. Using CFTC non-commercial futures positioning in S&P 500 futures contracts still has more betting the market will decline than rise. But just mildly below neutral. Future market returns tend to be more strongly positive when positioning is very negative. And vice versa. Today, there are a few more positioned bearish, based on e-mini S&P 500 futures. We would not characterize this as extreme, though, which certainly means the market could continue to improve, especially if more start placing positions on the bullish side. It is certainly something to keep an eye on. Worth noting small cap futures, based on the Russell 2000, are actually very bullishly positioned (which should be bearish).
Finally, there is momentum. Momentum measures of the market don’t differentiate between economic news, changing yields, changes in geopolitical risk, valuations or ever explain why the market is moving. But when momentum gets overly strong or overly weak, it usually mean reverts. As a result, extremes in momentum can also highlight good times to reduce and good times to put money to work when very low.
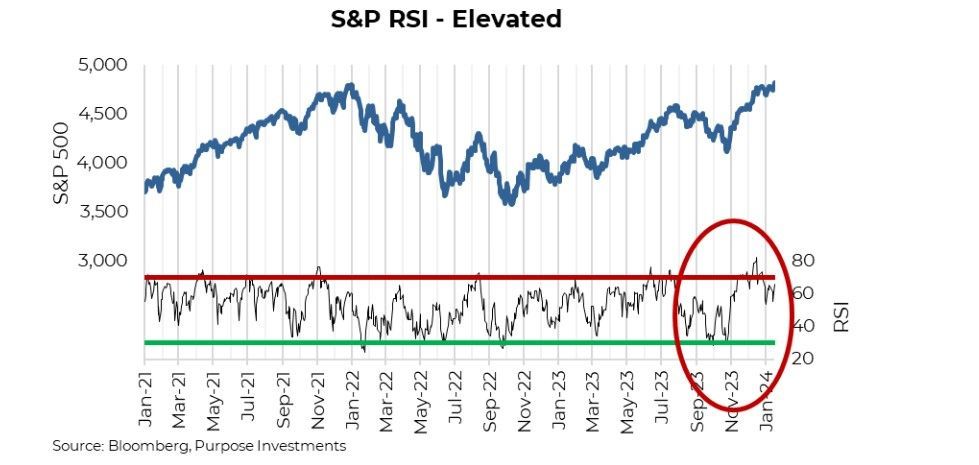
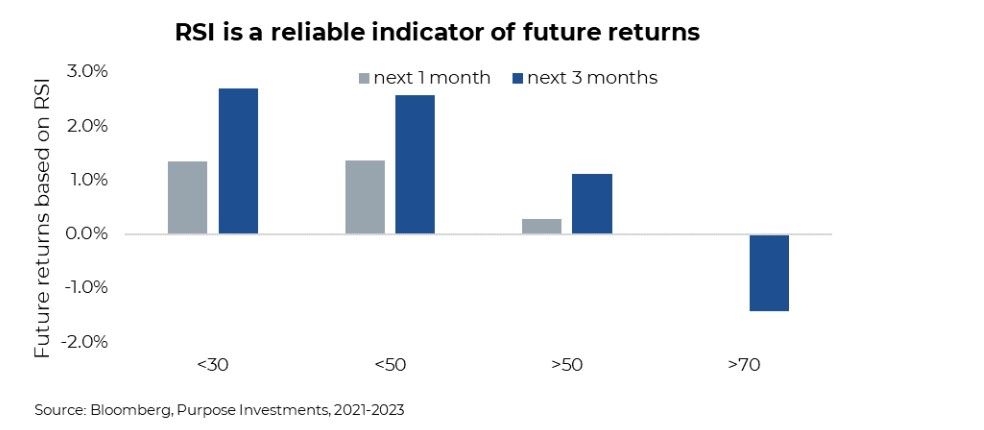
While this is only a few years, the table below does look similar over longer time periods. Simply put, the average forward return of the S&P 500 is much higher when RSI is low. And it is lower when RSI is higher. It’s worth noting RSI was well over 70 in late December.
Final Thoughts
We are big fans of long cycles, positioning based on return expectations, valuations, and where we are in the cycle. Again, earnings growth, which is determined by the economy, is the longer-term driver of market returns. But when you look at shorter periods, the importance of earnings growth fades, and the mood of the market dominates. Or more specifically, the changing market multiple caused by the changing mood of the market. Today, with RSI over 70 a few weeks back, investor sentiment is rather bullish. We would say the short-term risks are likely higher than the short-term potential gains. But you never know; the market is always moody.
— Craig Basinger is the Chief Market Strategist at Purpose Investments
Source: Charts are sourced to Bloomberg L.P. and Purpose Investments Inc.
The contents of this publication were researched, written and produced by Purpose Investments Inc. and are used by Echelon Wealth Partners Inc. for information purposes only. This report is authored by Craig Basinger, Chief Market Strategist, Purpose Investments Inc.
Disclaimers Echelon Wealth Partners Inc.
The opinions expressed in this report are the opinions of the author and readers should not assume they reflect the opinions or recommendations of Echelon Wealth Partners Inc. or its affiliates. Assumptions, opinions and estimates constitute the author's judgment as of the date of this material and are subject to change without notice. We do not warrant the completeness or accuracy of this material, and it should not be relied upon as such. Before acting on any recommendation, you should consider whether it is suitable for your particular circumstances and, if necessary, seek professional advice. Past performance is not indicative of future results. The comments contained herein are general in nature and are not intended to be, nor should be construed to be, legal or tax advice to any particular individual. Accordingly, individuals should consult their own legal or tax advisors for advice with respect to the tax consequences to them.
Purpose Investments Inc.
Purpose Investments Inc. is a registered securities entity. Commissions, trailing commissions, management fees and expenses all may be associated with investment funds. Please read the prospectus before investing. If the securities are purchased or sold on stock exchange, you may pay more or receive less than the current net asset value. Investment funds are not guaranteed, their values change frequently and past performance may not be repeated.
Forward Looking Statements
Forward-looking statements are based on current expectations, estimates, forecasts and projections based on beliefs and assumptions made by author. These statements involve risks and uncertainties and are not guarantees of future performance or results and no assurance can be given that these estimates and expectations will prove to have been correct, and actual outcomes and results may differ materially from what is expressed, implied or projected in such forward-looking statements. assumptions, opinions and estimates constitute the author’s judgment as of the date of this material and are subject to change without notice. Neither Purpose Investments nor Echelon Partners warrant the completeness or accuracy of this material, and it should not be relied upon as such. Before acting on any recommendation, you should consider whether it is suitable for your particular circumstances and, if necessary, seek professional advice. Past performance is not indicative of future results. These estimates and expectations involve risks and uncertainties and are not guarantees of future performance or results and no assurance can be given that these estimates and expectations will prove to have been correct, and actual outcomes and results may differ materially from what is expressed, implied or projected in such forward-looking statements. Unless required by applicable law, it is not undertaken, and specifically disclaimed, that there is any intention or obligation to update or revise the forward-looking statements, whether as a result of new information, future events or otherwise. Before acting on any recommendation, you should consider whether it is suitable for your particular circumstances and, if necessary, seek professional advice. The particulars contained herein were obtained from sources which we believe are reliable, but are not guaranteed by us and may be incomplete. This is not an official publication or research report of either Echelon Partners or Purpose Investments, and this is not to be used as a solicitation in any jurisdiction. This document is not for public distribution, is for informational purposes only, and is not being delivered to you in the context of an offering of any securities, nor is it a recommendation or solicitation to buy, hold or sell any security
Share this Blog