
Why?
Why?
Financial literacy is predicated on asking the question, “Why?” Why does this market keep moving higher? Why is inflation fading so slowly? Why are home prices high given low affordability? A stronger financial literacy or understanding likely leads to fewer investing mistakes; nobody likes mistakes. Our weekly publication often attempts to answer questions on various topics, dive into them, explain them, provide some context and share our views on what could happen next. In the past few weeks, we have talked about IPOs, gold, and inflation – hopefully improving our readers’ financial literacy and our own in the process of researching and writing.
Sometimes, the questions being asked are not macro topics such as the economy, or inflation, or upcoming elections, but more focused on portfolio construction and positioning. Why are our portfolios overweight Japanese equities? Why did we add preferred shares? Why is our credit exposure low? Why are we moderately underweight U.S. equities? To answer these questions,
we created the WHY Report, which is a monthly chart-heavy report that shares most of our current multi-asset portfolio tilts, explaining our rationale for that tilt. Most are working out well, some not so much. Even with strong financial
literacy, mistakes still happen.
With the first quarter of 2024 now in the rearview, today’s report dives into a number of portfolio tilts and sections from our monthly WHY Report. Why are we positioned the way we are? If you would like to receive the WHY Report on
a monthly basis, along with any changes to our positioning over time, there is a sign-up at the end of the report. Now, let’s jump into it.
There is very little to complain about in Q1. Bonds were down a smidge, but really only on the longer end of the curve. Add some credit, or shorter duration, and returns were roughly flat or up a bit. Hey, a boring bond market is actually kind of nice, given what we have experienced over the past few years.
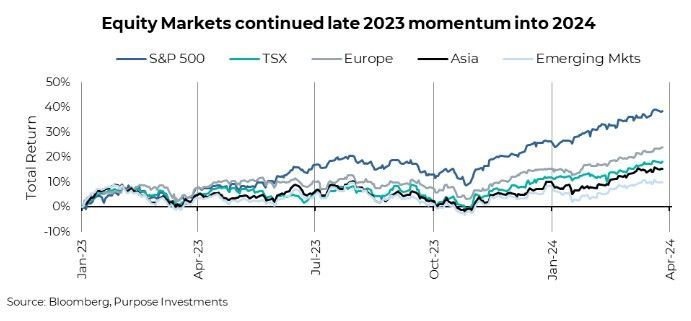
All the real excitement was in the equity markets. The S&P 500 is up over 10%, an impressive feat for a mere quarter. But it wasn’t just America; Europe and Japan both rose even more during the quarter. Japan was especially notable, making a new all-time high, something not accomplished since its bubble high of 1989. Just to bring back memories, in ’89, National Lampoon’s Christmas Vacation was the top box office hit… oh, the Griswolds. Canada’s TSX was a bit of a laggard, up less than 10%.
Even more impressive is that the equity market advance is rather broad-based. The S&P 500 still has a concentration problem, with the top ten names representing 33%, levels not experienced outside the dotcom and nifty fifty bubbles. There’s perhaps even higher concentration today. Some of those megacaps certainly helped drive performance in the first quarter of 2024, including Nvidia, Microsoft, Meta and Amazon. Yet, which companies do you think were the biggest drags on Q1 performance? Apple and Tesla were the biggest detractors; it is almost as if the Mag 7 has been split.
AI remained all the rage in Q1; in fact, you would argue the separation of the Mag 7 is sort of based on those companies that appear to have an edge in AI so far compared to others. But make no mistake, this market advance was broad based and it was helped by the economic data. The U.S. economy, which had already been proving very resilient continued in a similar fashion. It was more on the global economic data front that improved in Q1.
Market Cycle
The improved economic data has been picked up in our Market Cycle framework, potentially alleviating broader near-term recession risk. The Market Cycle is comprised of over 40 indicators, all of which have historically had some efficacy in showing turning points in the economic cycle. Some signals are from the bond market, U.S. or global economic data, some from sentiment, fundamentals, etc. The view is that not ever signal works in each cycle, so we have a diversified approach with many signals.
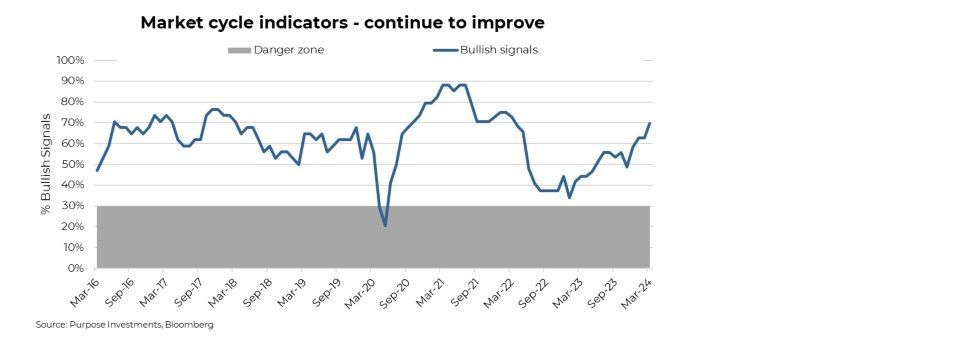
Equally important with the total bullish signal trend is what is happening underneath. It has been a big improvement from indicators associated with the global economy that has led to the more recent improvement in signals. Global manufacturing surveys, copper prices, semiconductor price trends, commodities and emerging market price behaviour are all bullish now. These were all bearish six months ago.
This doesn’t mean the market will keep going up. The market cycle is not a market timing tool; it is more of an indicator of recession risk. If it’s healthy during a period of market weakness, it's safer to view that as a buying opportunity. Now we just need some market weakness.
Why Moderate Underweight Equity and Holding More Cash
There is no denying that we are a bit more cautiously tilted, even with improving economic data. Our analogy is that we are still at the party, just not cutting a grove on the dance floor and instead standing closer to the door. We do not believe this market advance of late has the foundation to prove resilient.
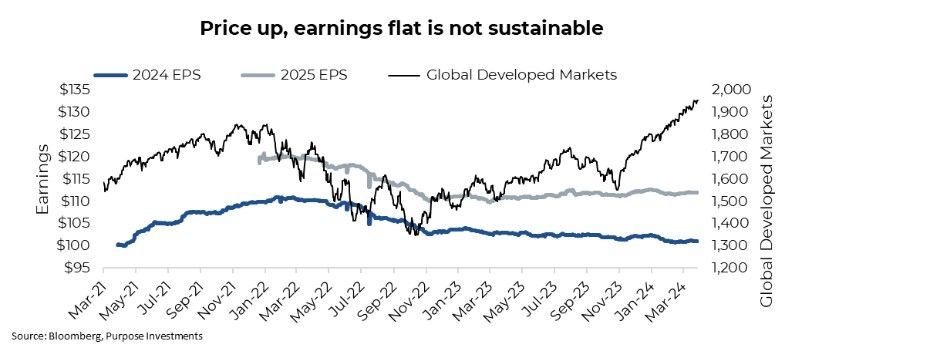
Earnings are a concern. If the economy were truly improving, why has this not translated into earnings forecasts? The chart below is global developed markets and headline consensus earnings estimates for 2024 and 2025. Earnings revisions and the market often move in tandem. Yet over the past year, we have seen market up and earnings flat, which means this is almost all multiple expansion.
We believe there are a number of headwinds for earnings growth. Higher rates and yields have a delayed impact on companies' income statements, which are starting to bite. Two years ago, S&P 500 companies paid about $50 billion in interest expenses during the quarter. In the latest quarter, that has increased to $70 billion. This is likely going to keep rising as fixed-term debt matures and is refinanced at higher rates.
Wage growth also remains elevated. The Atlanta Fed Wage Growth tracker is running at +5%, which is higher than inflation as a proxy for the company’s ability to raise prices. In fact, if inflation continue to cool, this too will be negative for earnings growth as a sign the ability to pass through higher costs is hitting some resistance.
Our other near-term concern is liquidity. The Federal Reserve is steadily reducing its balance sheet (quantitative tightening), and bank loan trends have been anemic. This should have resulted in less liquidity in Q1 had it not been for the draining of the reverse repo market. The repo market has fallen from almost $3 trillion to $750 billion over the past year, helping inject liquidity into the market. Now, there are many moving parts in these liquidity flows, but it is safe to say it has been positive for markets over the past couple of quarters. The problem is this may start to reverse in Q2 as the repo dwindles, and QT and other negative
factors will likely become more impactful.
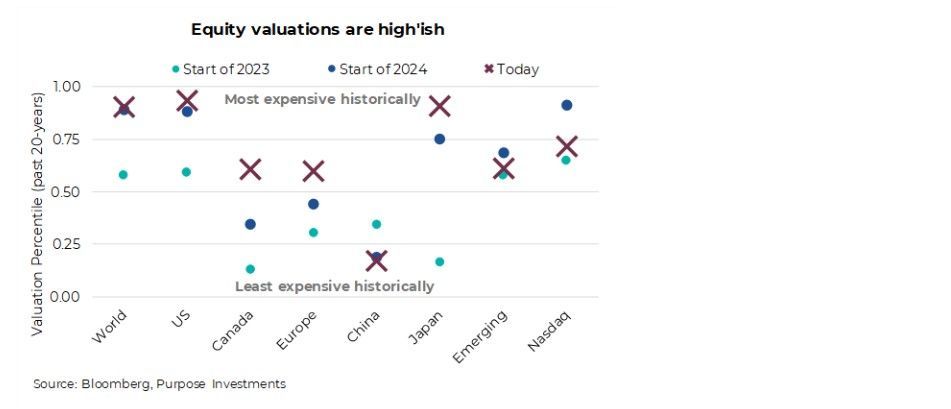
Add this to sentiment that appears extremely bullish (often a contrarian indicator) and very quiet market volatility. Plus valuations everywhere have become rather rich. The rapid rise in prices without earnings growth has pushed valuations higher. Not just in the U.S., even markets that had been on the cheaper side have become less so.
Put all this together, it remains prudent, in our opinion, to maintain a more conservative asset allocation. Including holding some extra cash as dry powder, should we run into market weakness in Q2.
Why We’re Warming to Emerging Markets
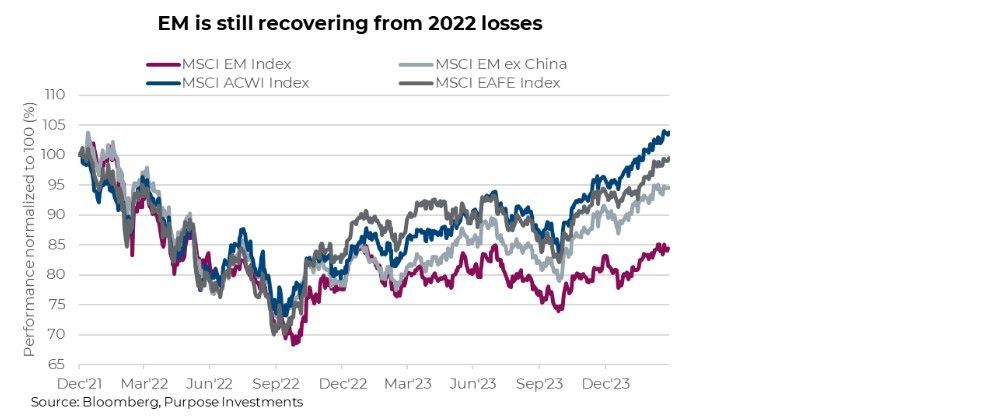
We’ve been underweight emerging markets in our multi-asset portfolios for some time. Our reasons were simple: the risks didn’t seem worth the reward, given global growth concerns. Over the past three years, emerging markets have lost 17%, while the S&P 500 has gained 38%. It gets worse the longer you look back. The performance spread over the past decade is over 200%. Because of this, emerging market equities remain markedly under-owned while at the same time becoming attractively valued and perhaps mispriced.
The whole purpose of our WHY Report is to consistently evaluate our positions and monitor the data. This monitoring is essential to prevent status-quo bias and remain entrenched in our view. As John Maynard Keynes said, “When the facts change, I change my mind- what do you do, sir?” Well, the facts are beginning to change, and the position is worth a deep re-evaluation to consider increasing exposure to emerging markets within our multi-asset portfolios. While the past decade saw a lacklustre performance in EM compared to developed markets (DM), several factors suggest that a potential reversal is nearing.
Reasons for optimism
Central bank pivot: After a period of tightening liquidity, central banks in developed economies are nearing an inflection point, potentially shifting towards rate cuts in mid-2024. This shift from monetary tightening to easing typically benefits emerging markets. It can help stimulate global growth, and with inflation falling, financial markets are stabilizing. In addition, many emerging markets have already begun their easing cycles as inflation measures across emerging markets continue to trend lower thanks to lower commodity prices and support from currency appreciation and tighter monetary policy.
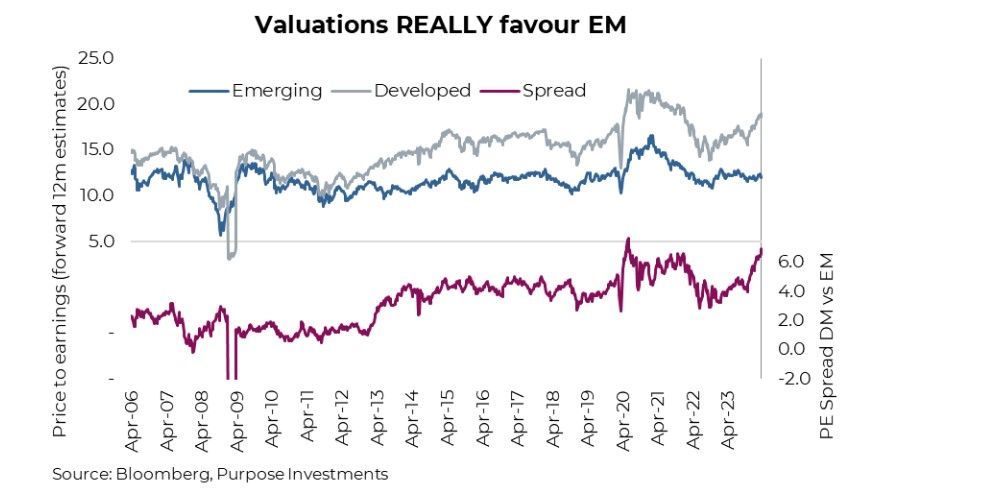
Undervaluation: Valuations in emerging markets are currently at a significant discount compared to developed markets. The valuation gap recently reached a 6-point spread, historically a good indicator of future outperformance for EM.
Earnings growth: In the coming years, emerging market companies are expected to see higher earnings growth than developed markets. While this hasn't translated to price performance yet, it suggests potential for future appreciation.
Recovering global trade: Global trade growth, which has been sluggish, is starting to show signs of improvement, particularly in export-driven economies like Korea and Taiwan. This trend is positive for emerging markets that are heavily reliant on trade. We expect the positive trend in global economic momentum to continue, although top-line U.S. GDP growth will likely moderate from its recent very strong pace. Global PMI continues to show signs of stabilization and is on the cusp of re-entering growth once
again. The key factor for capital markets will be the improving breadth of global growth, encompassing not only the three major economies of the U.S., the euro area and China but also the bulk of the emerging economies as global trade recovers.
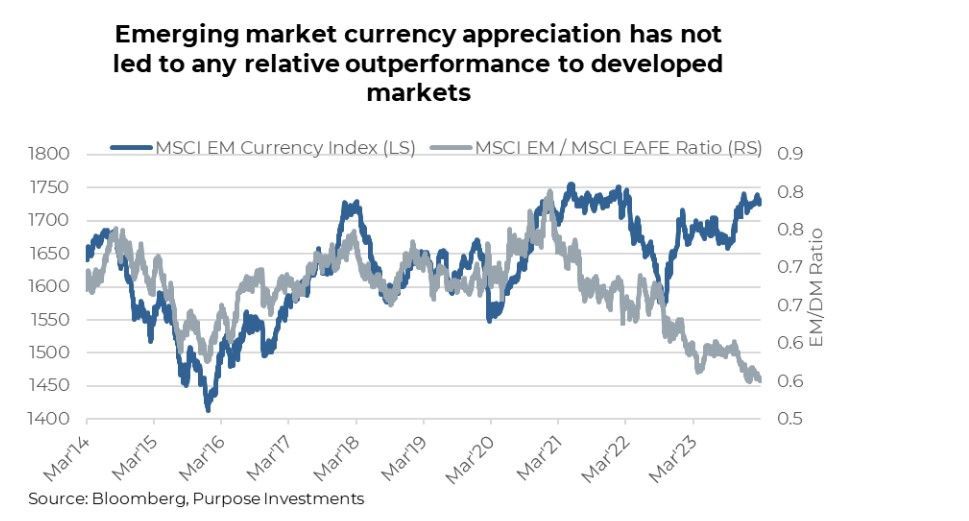
Currency appreciation: Local currency debt should get an added boost from EM currency appreciation this year. The MSCI Emerging Market Currency Index sets the weights of each currency equal to the relevant country weight in the MSCI EM Index. It’s seen considerable appreciation recently, which historically coincides with EM outperformance, but this has not been the case recently.
There is no question that emerging markets have experienced considerable challenges recently. But the key question is whether EMs offer better growth prospects than DMs. There remain big questions surrounding the direction and magnitude of global growth, especially with key developed countries in a technical recession. By contrast, EMs have shown considerable resilience, weathering higher borrowing costs, strong USD, inflation, and worsening trade conditions.
China – The shrinking elephant in the room
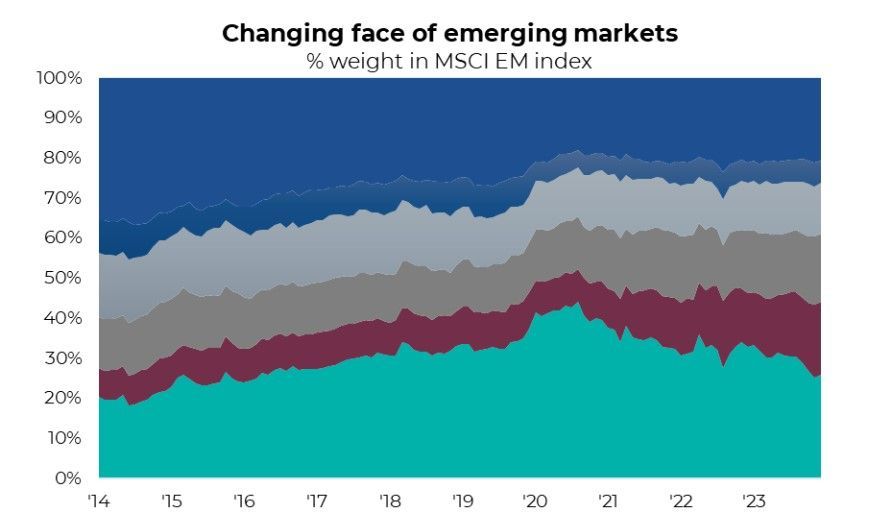
From a granular standpoint, many emerging markets have done quite well, including India, Taiwan and Brazil but China has held down the index. It’s impossible to hide the elephant in the room when considering emerging market exposure. Within the MSCI EM Index, China represents 26% of the index, including Hong Kong. A considerable amount of direct exposure. Indirectly, it also carries significant influence due to its influence in Asia and its impact on global commodity markets. Back in 2020, China peaked at nearly 44% of the index; its weight has shrunken considerably since then. Conversely, India is now up to 18%; ten years ago,
it was just 7.2%. If these trends continue, India could overtake China in the EM index. This is noteworthy, considering it overtook China in terms of population a year ago.
So, what could turn China around? Unlike the U.S., Europe, and Canada, changes in China’s economic policy tend not to be communicated prior to implementation. Within Asia, Japan and Indian markets are flying, but China is the exception. Their stock market is among the weakest, and the economy remains under pressure.
Coming out of Covid, the market expected a big rebound from China that never materialized due to the imploding property market along with the crackdown on big tech. Most of the recent pressure began when the government tried to crack down on the buildup of leverage in the housing industry. The result starved developers of capital, and the reverberations continue to be felt today. Though recent announcements have tried to stimulate the economy, it’s been more of a few warning shots compared to the bazooka credit impulse we’ve seen previously from China. Simply put, government efforts to reignite the growth engine have
been insufficient, and the country, which increasingly relies on the consumer, still has very low consumer confidence.
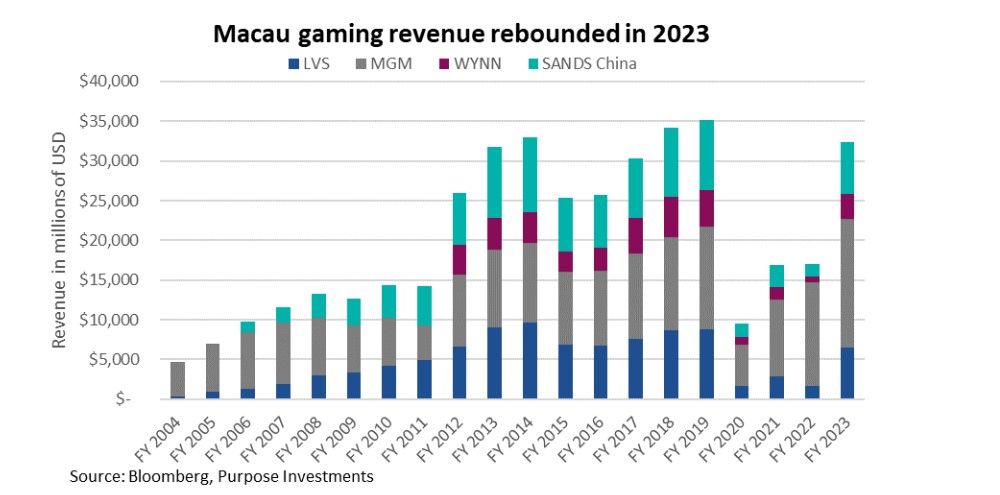
But this is beginning to change. While the Chinese consumer may not be buying Chanel handbags or iPhones at quite the same pace, gaming revenues in Macau have rebounded nearly back to 2019 levels. This is a positive development. Good spending may still be hampered, but experiential spending is healthy. Chinese air travel has already recovered and will likely extend its growth in 2024.
Chinese growth will lag peers like India. However, it’s very cheap, approaching near historic multiple spread to developed markets and stands to potentially rapidly benefit from any shift in government policy or inflection point in consumer spending. In addition, bearishness around Chinese equities may have reached a local peak. While far from uninvestable, the climate remains challenged, especially with the prospect of Trump returning to the Oval Office. Investors have tempered pessimism on China recently. Over the past couple of months, Chinese equities have matched the S&P 500. This is a good first step, but a full-on bullish tilt remains a bold contrarian call. But, like all contrarian calls, it can pay off generously to get in before the rest of the crowd.
Portfolio thoughts
Overall, we believe the potential benefits of emerging markets are beginning to outweigh the risks. The combination of attractive valuations, improving economic fundamentals, and a potential shift in global monetary policy creates a compelling opportunity for investors seeking long-term growth.
We think China has promise and presents one of the few contrarian opportunities in global markets right now. However, for some, it is simply uninvestable. If this is the case, there are EM ex-China funds that would also be attractive. India, Taiwan, and South Korea combine for 64% of this index but are all positioned favourably to benefit from strengthening economic prospects.
How to Use the WHY Report
‘Just trust me’ isn’t good enough
Over the years, our encounters with advisors and portfolio managers have often led us down a familiar path paved with a single query: "Why?" No, it's not the existential pondering of the universe but rather a pragmatic inquiry into our portfolio construction choices. It's a fair question, really. Looking back on discussions surrounding portfolio positioning, in our minds, the rationale behind our moves was crystal clear. But should advisors take the plunge and determine if the position makes sense for them? Well, that requires a bit more than a casual conversation. Enter the “Why Report,” an amalgamation of charts, graphs, and commentary that specifically apply to the positioning of our model portfolios. Because pairing investment decisions with a
little visual aid helps clarify complex concepts and addresses skepticism. After all, who doesn't love a good chart and rationale before diving into the financial deep end?
There are numerous portfolio positioning commentaries available for managers to review, and it's important to recognize that the Why Report isn't the definitive document among them. The report does not have a specific target audience, meaning whether you agree with the portfolio tilts or not, the report can have a use case within your practice. Its purpose is to create a report that maintains consistency, allowing it to be seamlessly integrated into the investment decision-making process.
While having an investment process framework is not a new revelation in portfolio management, any process should be open to improvements along its lifecycle. Our intention is to provide an optional improvement to the maturation of the process.
While conducting research and analysis to make a portfolio decision, the Why Report can be an excellent resource for sparking portfolio ideas. Perhaps you are considering investing in US equities. After reading the rationale for our portfolios being focused on equal-weight US equities, you find yourself in agreement or disagreement, which may result in a portfolio position change. This will naturally carry over into determining your asset allocation tilts within the portfolio. Clearly, being overweight in US equities over the last decade has been the correct investment decision, but has it gone too far? The report zeroes in on our portfolio tilts, offering insights that can guide decision-making for any portfolio. If our positioning aligns with yours, the report provides additional justification for your tilt. Conversely, if our positioning differs, the report offers contrarian perspectives that can ultimately benefit the overall portfolio.
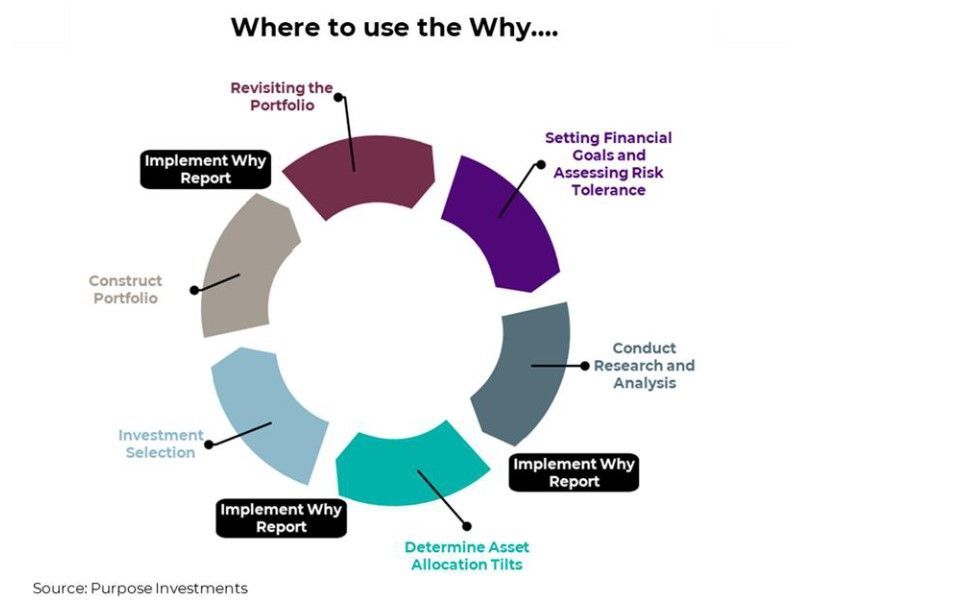
As the portfolio decision-making lifecycle progresses, it necessitates ongoing reviews and adjustments. Whether evaluating performance, reacting to shifts in the macroeconomic outlook, or making rebalancing decisions, the consistent availability of the Why Report provides a reliable resource to lean on.
The report also equips advisors and portfolio managers with visual aids and speaking points to use in conversations with clients. Not all of the content will apply to discussions or communications, perhaps none of it will, that will of course depend on the client. Also, this is not solely intended for portfolio managers. Clients are also able to benefit from this report, providing them with material to ask the right questions when it comes to how their investments are being managed by their trusted advisors.
If you are interested in improving your investment management process, we encourage you to sign up for Macro Strategy and Portfolio Construction Insights. Every month, we will provide subscribers with the Why Report (latest edition HERE). The content will not change drastically from month to month to be consistent, but any adjustments will be well reflected, and all charts will be updated to the most recent date. Additionally, we will include our monthly update surrounding our multi-asset portfolios, which will provide an in-depth commentary on the previous month and how those portfolios are positioned. Outside of the monthly distribution, subscribers will receive trade alerts and due diligence reports on the underlying holdings. Trade alerts will be paired with an in-depth rationale to provide insights into our thought process and portfolio evaluation.
Source: Charts are sourced to Bloomberg L.P. and Purpose Investments Inc.
The contents of this publication were researched, written and produced by Purpose Investments Inc. and are used by Echelon Wealth Partners Inc. for information purposes only. This report is authored by Craig Basinger, Greg Taylor and Derek Benedet Purpose Investments Inc.
Disclaimers
Echelon Wealth Partners Inc.
The opinions expressed in this report are the opinions of the author and readers should not assume they reflect the opinions or recommendations of Echelon Wealth Partners Inc. or its affiliates. Assumptions, opinions and estimates constitute the author's judgment as of the date of this material and are subject to change without notice. We do not warrant the completeness or accuracy of this material, and it should not be relied upon as such. Before acting on any recommendation, you should consider whether it is suitable for your particular circumstances and, if necessary, seek professional advice. Past performance is not indicative of future results. The comments contained herein are general in nature and are not intended to be, nor should be construed to be, legal or tax advice to any particular individual. Accordingly, individuals should consult their own legal or tax advisors for advice with respect to the tax consequences to them.
Purpose Investments Inc.
Purpose Investments Inc. is a registered securities entity. Commissions, trailing commissions, management fees and expenses all may be associated with investment funds. Please read the prospectus before investing. If the securities are purchased or sold on a stock exchange, you may pay more or receive less than the current net asset value. Investment funds are not guaranteed, their values change frequently and past performance may not be repeated.
Forward Looking Statements
Forward-looking statements are based on current expectations, estimates, forecasts and projections based on beliefs and assumptions made by author. These statements involve risks and uncertainties and are not guarantees of future performance or results and no assurance can be given that these estimates and expectations will prove to have been correct, and actual outcomes and results may differ materially from what is expressed, implied or projected in such forward-looking statements. Assumptions, opinions and estimates constitute the author’s judgment as of the date of this material and are subject to change without notice. Neither Purpose Investments nor Echelon Partners warrant the completeness or accuracy of this material, and it should not be relied upon as such. Before acting on any recommendation, you should consider whether it is suitable for your particular circumstances and, if necessary, seek professional advice. Past performance is not indicative of future results. These estimates and expectations involve risks and uncertainties and are not guarantees of future performance or results and no assurance can be given that these estimates and expectations will prove to have been correct, and actual outcomes and results may differ materially from what is expressed, implied or projected in such forward-looking statements. Unless required by applicable law, it is not undertaken, and specifically disclaimed, that there is any intention or obligation to update or revise the forward-looking statements, whether as a result of new information, future events or otherwise. Before acting on any recommendation, you should consider whether it is suitable for your particular circumstances and, if necessary, seek professional advice. The particulars contained herein were obtained from sources which we believe are reliable, but are not guaranteed by us and may be incomplete. This is not an official publication or research report of either Echelon Partners or Purpose Investments, and this is not to be used as a solicitation in any jurisdiction. This document is not for public distribution, is for informational purposes only, and is not being delivered to you in the context of an offering of any securities, nor is it a recommendation or solicitation to buy, hold or sell any security.
Share this Blog