
What happens on the other side?
What Happens On The Other Side?
Each year since 1978, the Federal Reserve Bank of Kansas City has sponsored a symposium on an important economic issue facing the U.S. and world economies. This annual pilgrimage to the beautiful mountain resort town of Jackson Hole, attracting bankers, finance ministers, academics, and financial market participants from around the world for its economic symposium, is
highlighted by a keynote speech by the Federal Reserve President. Last year, Jay Powell dropped the mic and surprised markets with his steadfastness to raise rates to fight inflation. This year, it was less of an event, with very little that is new, but we still appreciate the gorgeous CNBC backdrops. It’s becoming clear that the steep hiking path is likely nearing its end, but the big
question is… what happens on the other side?
With the soft landing outcome gaining steam, bankers likely feel some satisfaction and a sense of achievement after reaching the peak after the painstaking path that began last March… it reminds us of the Latin saying, dulcius ex asperis, which means ‘sweeter after difficulties’ (admittedly, we’re not Latin experts, but we came across the saying watching the Sandy B movie, The
Lost City). Both the Fed and Bank of Canada were busy with an accelerated steepening cycle that pushed up borrowing costs, contributed to the bear market last year and tightened financial conditions that have yet to be fully felt in the economy. We don’t know what will happen in the future or if we’re at peak rates right now, but the market seems sure we’re close if not there already. The end may be at hand – but the Fed will remain agnostic and data-dependent.
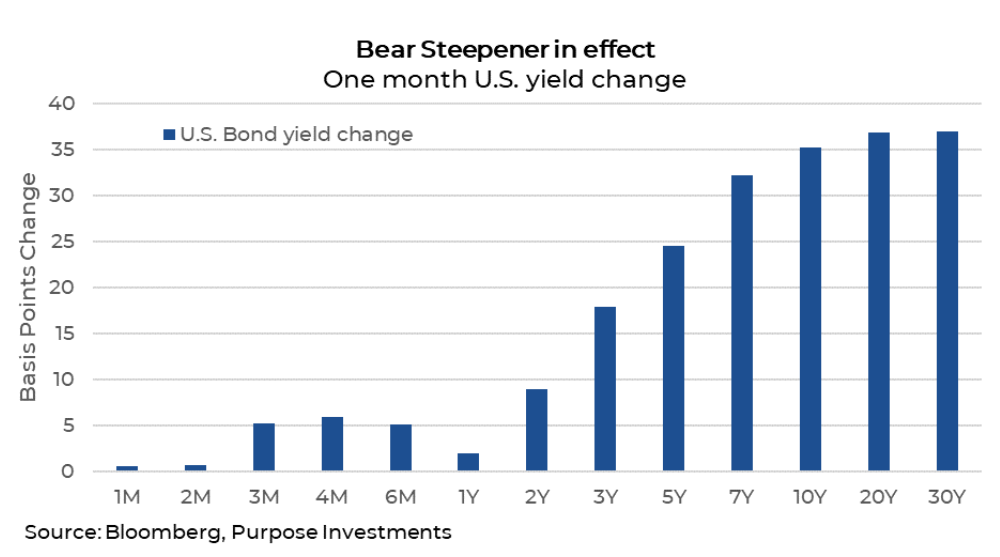
Long bond yields have steadily pushed higher over the past few months. With U.S. 10yr bond yields solidly back over 4%, expectations of higher for longer rates have resurfaced, which is one of the reasons why stocks have wobbled in August. Higher long bond yields pose a conundrum for valuations across asset classes. What’s interesting is this move in rates has been primarily focused on the long end of the curve. The chart below shows the basis point change across the various bond tenures for the U.S. yield curve. This clearly shows how long bond yields have been rising more than short rates, with 10s hitting their highest level since 2007. Sure, there are some more nuanced drivers of the move; some blame the Bank of Japan or the Fitch downgrade, but the real reason is that recession fears have subsided, inflation is still present, and the economy is doing better than expected. While this sounds good, unfortunately, bear-steepeners like this cause confusing signals and are historically not great for the economy, often preceding recessions.
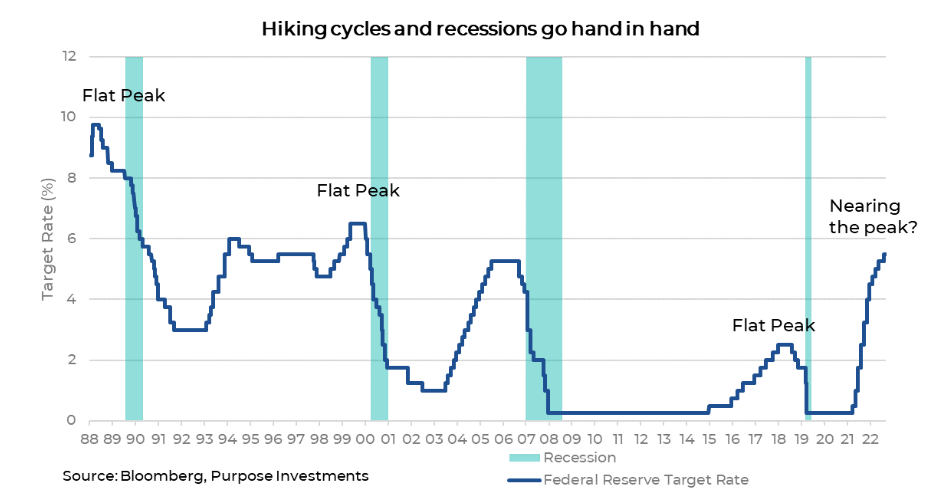
So, what precisely can we expect on the other side of peak rates? Historically, there’s a pause period, where the economy is doing alright, before lagged effects of the hike worth their way through the economy, leading to a recession. Looking back to the early 90s, this period we’ll call the “flat peak” can last anywhere from 100 to 445 days, averaging 229 days before central banks cut rates when a recession is apparent. We don’t know if we’re at the peak yet or not, but the markets are straightforward with their pricing. Fed funds futures show rates topping out at the November meeting with an implied rate of 5.46%, about 13bps higher than the effective rate today. This is less than a single hike, so the implied probability of hiking is still low. The futures market expects the Fed to start cutting in mid-2024. This timeframe is consistent with the average length of prior peaks in 1995, 2000, 2006, and 2018.
On the other side
Timing the turn is not impossible. Still, looking past the crest, we wanted to examine what areas of the market tend to outperform after central banks stop tightening. We looked at the best and worst sectors going back to 1990 for clues, specifically the 6- and 9-month periods following the Fed's last hike. What became immediately apparent is that every cycle is unique, and there is no clear playbook. No surprise there. But digging into the data did reveal some interesting tendencies.
Some themes from prior cycles are apparent: Health Care, Staples, Financials, and Tech were among the best average performers, outperforming the market across multiple time periods. In terms of a win rate across these four previous peaks, Health Care, Financials, and Teck all did quite well, outperforming the S&P 500 75% of the time. It’s interesting that the average returns for Technology stocks were so strong, considering this period included the washout performance of 2000. It helped that Technology shares were some of the best performing in the post-hike periods of 1995 and 2018. The worst-performing sectors were Energy and Materials, including gold miners, steel makers and specialty chemical companies. Communication Services stocks surprisingly weren’t too great either; however, they were some of the best-performing stocks during the 2006 period. Other cyclicals, such as Consumer Discretionary stocks and Industrials, also lagged.
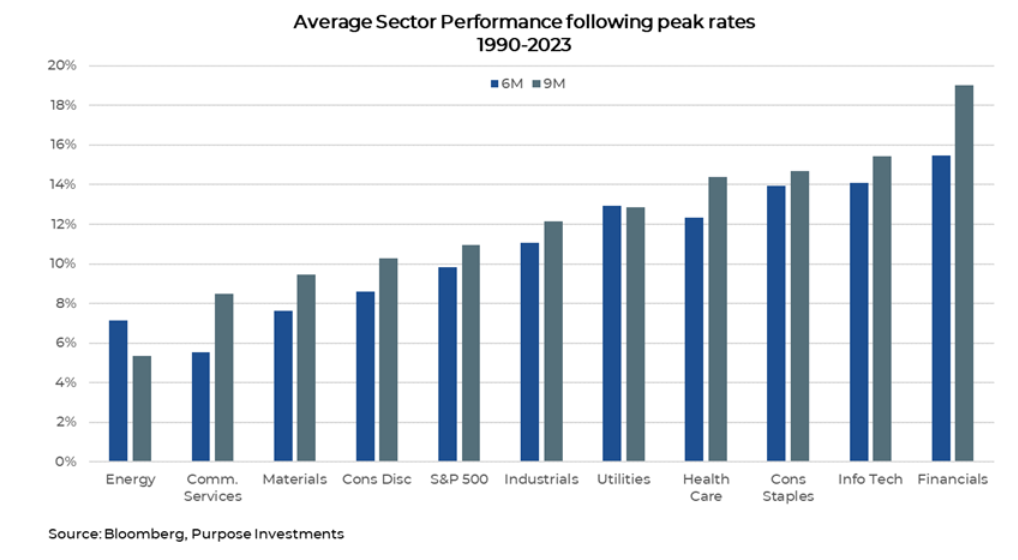
Markets, on average, were positive over these periods, with only the 2000 period seeing a decline in the overall market once the Fed stopped hiking. Tech was crushed that year, and the defensive nature of Staples and Health Care were huge winners with a relative outperformance of over 20%
Final Thoughts
The long end of the curve is doing some work for central bankers, tightening financial conditions so perhaps they don’t have to. For now, markets aren’t convinced that we’ll see another hike, so perhaps the peak is in. Given that it’s a good time to examine portfolios to ensure they are in line with what could happen in a peak rates scenario. This typically means adding some duration and increasing sector exposure to more rate-sensitive stocks. Given some of the best-performing sectors post-peak have sold off recently, this makes them even more attractive from a relative value standpoint. Within our dividend funds, such as the Purpose Core Equity Income fund, we’re increasingly tilted towards Health Care, Staples, and other rate-sensitive securities that tend
to benefit when we reach the peak and get to the other side.
— Derek Benedet is a Portfolio Manager at Purpose Investments
Source: Charts are sourced to Bloomberg L.P. and Purpose Investments Inc.
The contents of this publication were researched, written and produced by Purpose Investments Inc. and are used by Echelon Wealth Partners Inc. for information purposes only.
This report is authored by Craig Basinger, Chief Market Strategist, Purpose Investments Inc.
Disclaimers
Echelon Wealth Partners Inc.
The opinions expressed in this report are the opinions of the author and readers should not assume they reflect the opinions or recommendations of Echelon Wealth Partners Inc. or its affiliates. Assumptions, opinions and estimates constitute the author's judgment as of the date of this material and are subject to change without notice. We do not warrant the completeness or accuracy of this material, and it should not be relied upon as such. Before acting on any recommendation, you should consider whether it is suitable for your particular circumstances and, if necessary, seek professional advice. Past performance is not indicative of future results. The comments contained herein are general in nature and are not intended to be, nor should be
construed to be, legal or tax advice to any particular individual. Accordingly, individuals should consult their own legal or tax advisors for advice with respect to the tax consequences to them.
Purpose Investments Inc.
Purpose Investments Inc. is a registered securities entity. Commissions, trailing commissions, management fees and expenses all may be associated with investment funds. Please read the prospectus before investing. If the securities are purchased or sold on a stock exchange, you may pay more or receive less than the current net asset value. Investment funds are not guaranteed, their values change frequently and past performance may not be repeated.
Forward Looking Statements
Forward-looking statements are based on current expectations, estimates, forecasts and projections based on beliefs and assumptions made by author. These statements involve risks and uncertainties and are not guarantees of future performance or results and no assurance can be given that these estimates and expectations will prove to have been correct, and actual outcomes and results may differ materially from what is expressed, implied or projected in such forward-looking statements. Assumptions, opinions and estimates constitute the author’s judgment as of the date of this material and are subject to change without notice. Neither Purpose Investments nor Echelon Partners warrant the completeness or accuracy of this material, and it should not be relied upon as such. Before acting on any recommendation, you should consider whether it is suitable for your particular circumstances and, if necessary, seek professional advice. Past performance is not indicative of future results. These estimates and expectations involve risks and uncertainties and are not guarantees of future performance or results and no assurance can be given that these estimates and expectations will prove to have been correct, and actual outcomes and results may differ materially from what is expressed, implied or projected in such forward-looking statements. Unless required by applicable law, it is not undertaken, and specifically disclaimed, that there is any intention or obligation to update or revise the forward-looking statements, whether as a result of new information, future events or otherwise. Before acting on any recommendation, you should consider whether it is suitable for your particular circumstances and, if necessary, seek professional
advice. The particulars contained herein were obtained from sources which we believe are reliable, but are not guaranteed by us and may be incomplete. This is not an official publication or research report of either Echelon Partners or Purpose Investments, and this is not to be used as a solicitation in any jurisdiction.
This document is not for public distribution, is for informational purposes only, and is not being delivered to you in the context of an offering of any securities, nor is it a recommendation or solicitation to buy, hold or sell any security
Share this Blog