
Bulls, Bears, and Pumpkin Spice
Bulls, Bears, and Pumpkin Spice
Investor sentiment is a pendulum that swings back and forth between extreme optimism and extreme pessimism and never sits still. Every individual stock has its own little pendulum. At times investors rapaciously bid up shares, believing prices will continue driving prices to irrational levels. In contrast, when the pendulum swings the other way, investors want nothing to do with the stock market. Selling pressure drives prices to irrational levels as well, with the stock languishing and few motivated buyers in sight. Sentiment shifts are subtle at first, but an increase in momentum can quickly escalate. These shifts typically occur at the extremes; the fear of missing out kicks in when the market goes higher and makes investors want to buy. When it moves lower, it
makes you want to sell because you don’t want to lose what you have. Buy high and sell low isn’t how it’s supposed to work, but that’s how our brains and emotions operate. Unfortunately, the market and your brain never scream at you to do the right thing, only the wrong thing. It’s why gauging current market sentiment can help investors understand and hopefully be prepared for those important shifts.
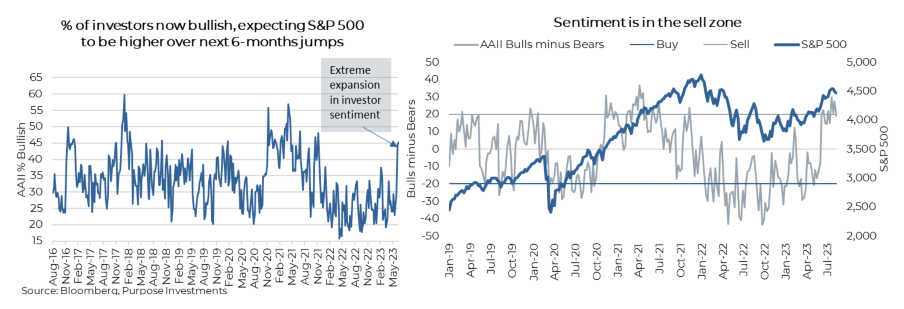
At an aggregate level, market sentiment can be measured in many ways. One of our favourites is the AAII Investor Sentiment Survey. The American Association of Individual Investors has been doing a simple weekly survey since 1987. The long history makes it an ideal data set to understand the relationship between sentiment and stock returns. The most recent reading shows that bullish sentiment is unusually high for the second time in three weeks, while bearish sentiment is below average for the 8th time in 10 weeks. Bullish sentiment has risen extremely fast the past couple of months, as detailed in the chart below, and while
not at historical extremes, the spread between the bulls and bears moved into the ‘sell zone’ a few weeks ago. When the spread is above 20, it means that the bulls are in control and the pendulum has swung nearly to its limits. On the other hand, below -20 is the ‘buy zone’ where bearish sentiment is extreme and future returns are more promising.
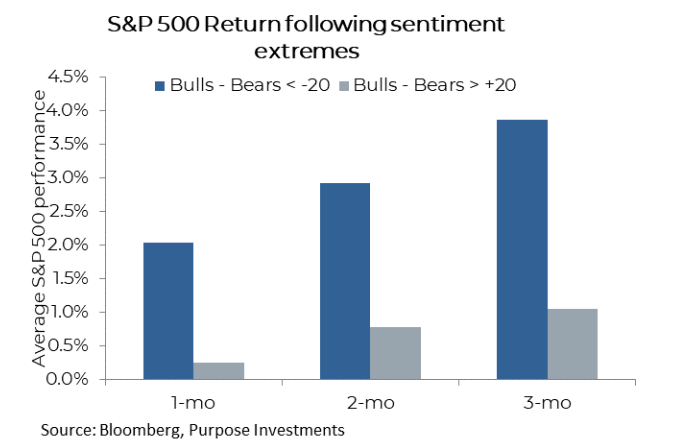
So what does this mean for investors? The chart below shows S&P 500 future returns following sentiment extremes. This clearly shows the benefits of buying low, with future 3-month returns at bearish sentiment extremes nearly four times higher compared to future returns when sentiment is extremely bullish. The most recent AAII release on August 10th has the spread falling back under 20, so the bullish sentiment has backed off slightly but has spent the past three weeks in the sell zone.
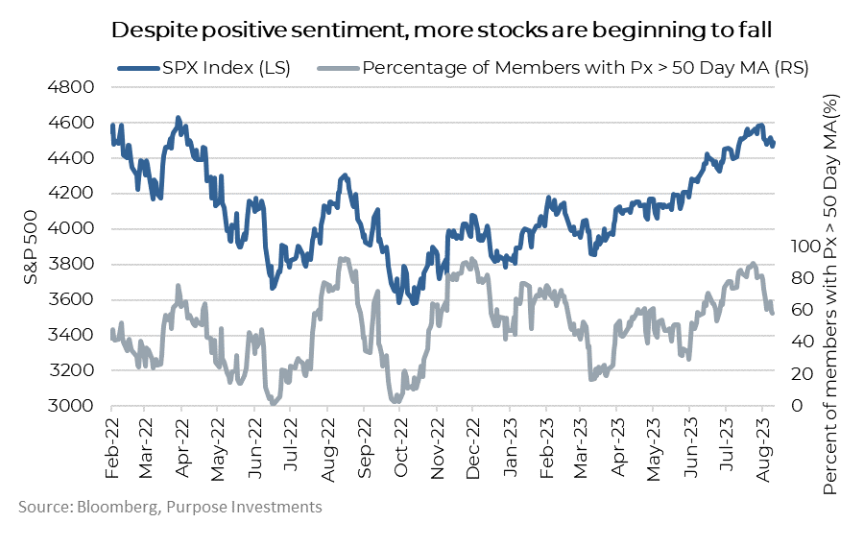
There are many ways to measure sentiment. One other noteworthy method is gauging how pervasive the positive sentiment is. While also a breadth measure, looking at the percent of members above their 50-day moving averages helps with this. It’s now turning back down after recently reaching the year's highest level. While the S&P 500 is only down 2% from recent highs, 25% of companies within the index have fallen below their 50-day moving averages. This warrants some concern as this type of reversal has a good track record of identifying decent-sized pullbacks.
Beware the pumpkin spice
We’re nearing that time of year. By the end of the month, we’ll be bombarded by pumpkin spice everything. We blame Starbucks and influencers for this trend. Pumpkin spice has been as synonymous with fall as crisp autumn air and changing leaves. Apologies for jumping the gun, but August is almost half over, and September is just around the corner.
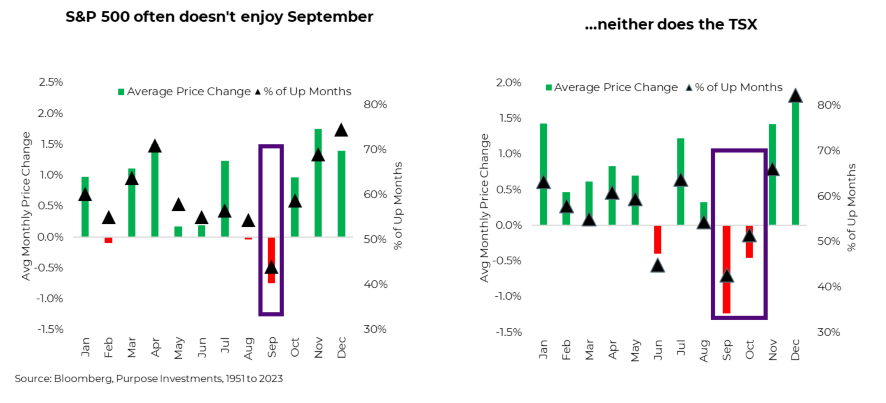
Besides stretched investor sentiment, one other potential risk on the horizon for investors is seasonality – whether real or perceived, seasonality and sentiment are inexorably intertwined. Bit of a chicken and egg situation, but market seasonality assumes some sort of repeating sentimental shift in risk aversion, which in turn affects prices. Seasonality in stock returns has been known for decades. As the chart below shows, average monthly stock returns are negative in September and extremely positive around the turn of the year. Going back to 1951, the average return in September in Canada is -1.2%, with just 42% of the months positive. December is the highest, with an average of 1.7% with a win rate of 82%. Now these are averages, so it’s not a guaranteed exploitable trading event, but the numbers are on your side to tread carefully and take some risk off the table. Anyone surprised if the market were to sell off in the next month or so is NOT a student of market history.
We’ve seen some research that attempts to attribute seasonality to Seasonal Affective Disorder (SAD). We’re certainly sad to see summer go, but the sad reality is that in September, trading desks are back at full staff, and real work gets done. More often than not, it seems it’s a time of profit-taking, de-risking, and of course, a pumpkin spice latte.
Final Thoughts
Sentiment is not the be-all and end-all of investing. If only it were that easy. But it is important, especially at extremes. The big question is whether or not we’re in a new bull market or is this just the mother of all bear market rallies. The market loves the soft-landing narrative, and given how well markets have performed the past few months, it's really taken hold. Looking at the global economic data, there is still enough ambiguity to not rule it out. For an investor, if you believe in the soft landing, it makes sense to rush into risk assets now before the data plays out. But this is simply greed taking hold. This still could be a big bear market trap, and given stretched sentiment and heading into the seasonal weak season for markets, we caution investors not to join the herd.
— Derek Benedet is a Portfolio Manager at Purpose Investments
Source: Charts are sourced to Bloomberg L.P. and Purpose Investments Inc.
The contents of this publication were researched, written and produced by Purpose Investments Inc. and are used by Echelon Wealth Partners Inc. for information purposes only.
This report is authored by Craig Basinger, Chief Market Strategist, Purpose Investments Inc.
Disclaimers
Echelon Wealth Partners Inc.
The opinions expressed in this report are the opinions of the author and readers should not assume they reflect the opinions or recommendations of Echelon Wealth Partners Inc. or its affiliates. Assumptions, opinions and estimates constitute the author's judgment as of the date of this material and are subject to change without notice. We do not warrant the completeness or accuracy of this material, and it should not be relied upon as such. Before acting on any recommendation, you should consider whether it is suitable for your particular circumstances and, if necessary, seek professional advice. Past performance is not indicative of future results. The comments contained herein are general in nature and are not intended to be, nor should be
construed to be, legal or tax advice to any particular individual. Accordingly, individuals should consult their own legal or tax advisors for advice with respect to the tax consequences to them.
Purpose Investments Inc.
Purpose Investments Inc. is a registered securities entity. Commissions, trailing commissions, management fees and expenses all may be associated with investment funds. Please read the prospectus before investing. If the securities are purchased or sold on a stock exchange, you may pay more or receive less than the current net asset value. Investment funds are not guaranteed, their values change frequently and past performance may not be repeated.
Forward Looking Statements
Forward-looking statements are based on current expectations, estimates, forecasts and projections based on beliefs and assumptions made by author. These statements involve risks and uncertainties and are not guarantees of future performance or results and no assurance can be given that these estimates and expectations will prove to have been correct, and actual outcomes and results may differ materially from what is expressed, implied or projected in such forward-looking statements. Assumptions, opinions and estimates constitute the author’s judgment as of the date of this material and are subject to change without notice. Neither Purpose Investments nor Echelon Partners warrant the completeness or accuracy of this material, and it should not be relied upon as such. Before acting on any recommendation, you should consider whether it is suitable for your particular circumstances and, if necessary, seek professional advice. Past performance is not indicative of future results. These estimates and expectations involve risks and uncertainties and are not guarantees of future performance or results and no assurance can be given that these estimates and expectations will prove to have been correct, and actual outcomes and results may differ materially from what is expressed, implied or projected in such forward-looking statements. Unless required by applicable law, it is not undertaken, and specifically disclaimed, that there is any intention or obligation to update or revise the forward-looking statements, whether as a result of new information, future events or otherwise. Before acting on any recommendation, you should consider whether it is suitable for your particular circumstances and, if necessary, seek professional advice.
The particulars contained herein were obtained from sources which we believe are reliable, but are not guaranteed by us and may be incomplete. This is not an official publication or research report of either Echelon Partners or Purpose Investments, and this is not to be used as a solicitation in any jurisdiction.
This document is not for public distribution, is for informational purposes only, and is not being delivered to you in the context of an offering of any securities, nor is it a recommendation or solicitation to buy, hold or sell any security
Share this Blog